Evolutionary Stability of Fluorescent Protein or Chromoprotein Expression
Procedure for Studying the Evolutionary Stability of a Chromoprotein in TOP10 and/or MDS42 Cells
This procedure can also be used for studying any similar genetic device, such as a device encoding a fluorescent protein. The specifics below are from an experiment conducted by Riya Sreenivasan, an FRI/iGEM student during summer 2016.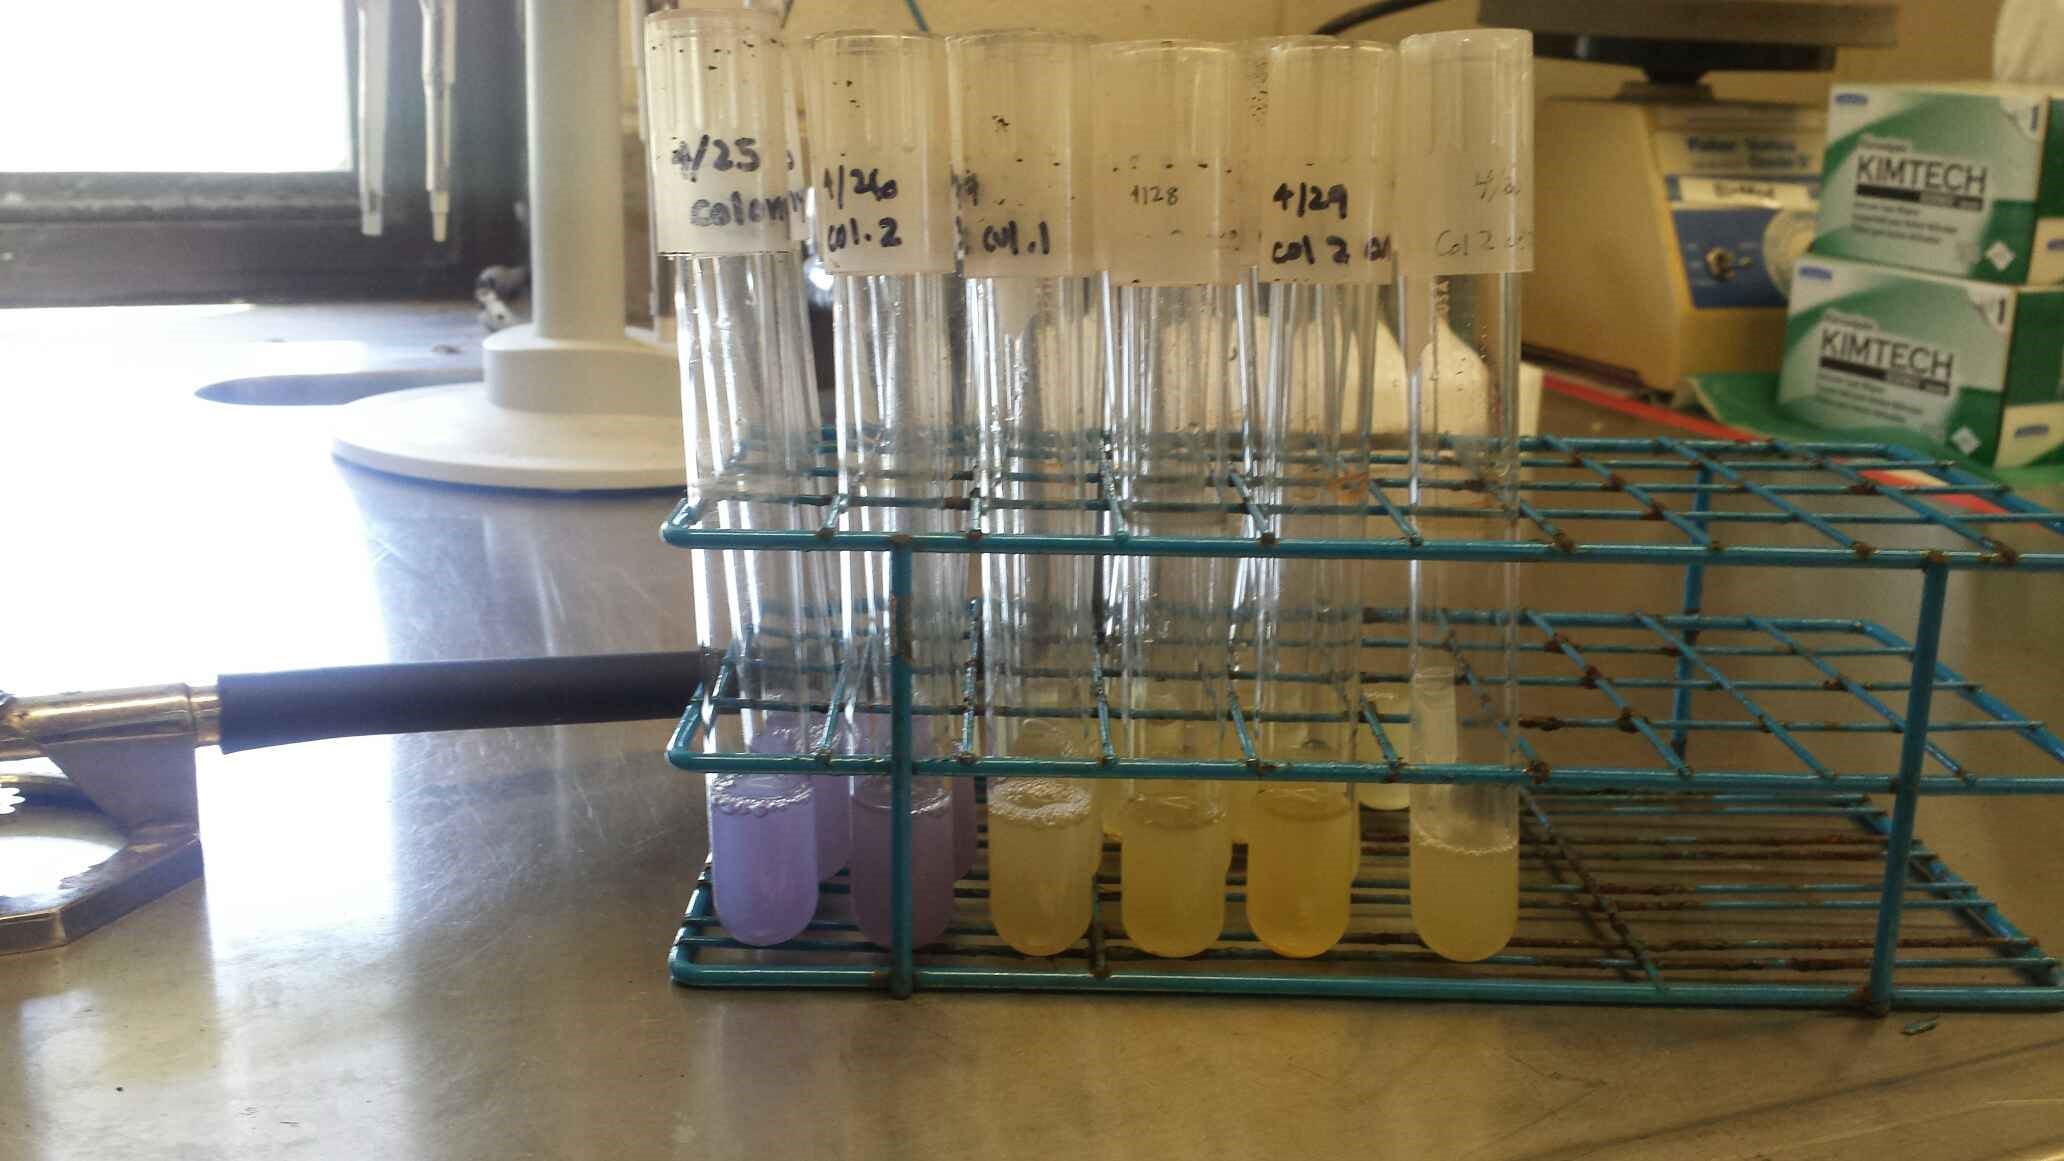
The above image shows the blue chromoprotein construct (described below) over the course of 6 days, using the procedure below.
Day 0
Streak out frozen stocks of two strains on two separate plates containing LB and the appropriate antibiotic.- The two strains in this specific case are:
- TOP10 E. coli with biobrick (K592009) and "vector" (K608002)
- MDS42 E. coli with biobrick (K592009) and "vector" (K608002)
- The antibiotic in this case is CAM (chloramphenicol).
- Get an ice bucket and fill with ice.
- Make or find two LB/CAM plates. Normally, they are in the cold room (4°C).
- Collect previously made frozen glycerol stocks (the two strains described above) from the -80°C freezer and place them on ice.
- Quickly return to your bench and use sterile technique
- Sterilize bench top with 70% EtOH
- Light your bunsen burner
- Sterilize an inoculation loop (immerse in 70% EtOH and flame until the loop is visibly red hot)
- Use the inoculation loop to streak out your cells onto each plate (refer to FRI Lab 2 streaking procedure or standard streaking procedure). Flame in between streaking quadrants.
- Flip the plates upside down and place them in the 37°C incubator overnight
- Make sure you have enough culture tubes and reagents for the next day. You can make these now or tomorrow. Labeling tubes often take a long time. I suggest doing this the day before.
Day 1
Today is Day 1 of growing your strain(s) in liquid culture. These first culture tubes are dubbed "Day 1" culture tubes.- Your plates will need to grow in the incubator for at least 20 hours.
- Record/document observations of your plates.
- How many colonies?
- Are there colors or fluorescence?
- Are the colonies isolated?
- Anything interesting on the plate?
- Do the colonies all look the same?
- TAKE PICTURES!!!
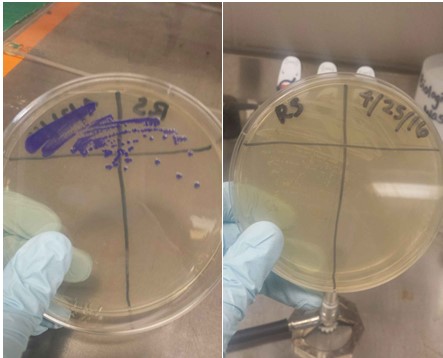 Plates of two different Blue Chromoprotein (BCP) strains streaked out. The one is still expressing high levels of BCP. The other strain is not. Side note: BCP is commonly referred to as "AmilCP".
Day 1 Procedure: Starting your Overnight (O/N) cultures from colonies.
Plates of two different Blue Chromoprotein (BCP) strains streaked out. The one is still expressing high levels of BCP. The other strain is not. Side note: BCP is commonly referred to as "AmilCP".
Day 1 Procedure: Starting your Overnight (O/N) cultures from colonies. - Sterilize your bench and turn on the Bunsen burner.
- Collect 12 culture tubes and label them (Day 1, your initials, date, strain, and colony #1-6).
- Fill each culture tube with 5ml of LB/CAM culture using a disposable plastic pipette.
- Pick six independent colonies from each plate that appear to maintain the desired phenotype and start six 5 ml overnight cultures in LB/CAM media for each strain. The six colonies should appear to still be among the "brightest" or rather have the same amplitude as the original phenotype had.
- This is not guaranteed for all devices, since very unstable devices may already be broken. If there arent enough colonies with the desired phenotype, make a new plate. If you need to do this, one trick is to streak out from one of the colonies that displays the current phenotype, even if it is not isolated. Your new plate will likely have many more candidates to start from.
- Circle 6 chosen colonies with a sharpie on each plate
- How to pick the colonies:
- Using a sterile p1000 tip, gently pierce through the entire colony and agar.
- Place the entire tip into the culture tube. Slowly and gently pipette up and down to dislodge the agar and colony into the media.
- Then, gently eject the tip so that it remains in the culture tube.
- Do this for all 6 chosen colonies, using a new pipette tip each time.
- Repeat this for both strains.
- Place all culture tubes into the shaker incubator (37°C and at 200-225 RPM) overnight. RECORD your temperature and RPM. Use the same settings and incubator throughout the entire experiment.
- Place the plates in the cold room (4°C) on the shelf labeled for your group. The plates should be wrapped in parafilm and be placed upside down to prevent water from pooling on the lid.
Day 2
Your cultures will need to grow in the incubator overnight. We suggest for at least 20 hours. Record this length of time and attempt to repeat this exact length of time as closely as possible. It is okay if you over shoot by an hour or two, but make sure the overnight culture is fully saturated. NOTE: Saturation of these cultures should happen in less than 20 hrs, but better safe than sorry.- Record/document observations of your cultures.
- Is there color?
- Did they grow?
- How many generations have passed?
- -We estimate that from ~35 generations have passed from a single cell on a plate growing to a colony and then the entire colony growing in the 5 ml culture to saturation. That means on Day 2, you should be at ~35 generations total. Record this number each day.
- Take pictures! Take picture in day light or blue light or whatever conditions are required to see the observable phenotype. Depending on the stability of the proteins producing your phenotype, the phenotype of a culture in the cold room could change over time.
- Turn on the Bunsen burner and use sterile technique
- Find 12 microcentrifuge tubes and label them (1 for each O/N culture-strain and colony #)
- These tubes will be used to hold a small amount of Day 1 culture.
- This culture will be used to measure record the fluorescence in a 96 well plate, if appropriate.
- This culture will also be used to start the Day 2 cultures.
- Make sure the cultures are fully resuspended. If they were sitting in the cold room or a bench for more than 15 minutes, carefully vortex the culture until a homogenous mixture is created
- Remove 250 µl from each O/N culture and place into its respective microcentrifuge tube Now, we will start a fresh 5 ml culture for each O/N culture.
- Locate 12 new culture tubes and label them (Day 2, your initials, date, strain, and colony #1-6)
- Pipette 5 ml of LB/CAM media into each culture tube under sterile conditions.
- You will be performing a 1:1000 dilution of the Day 1 culture into the new media.
- Add 5 µl of each Day 1 culture from the appropriate microcentrifuge tube into the Day 2 culture tube for that strain.
- Place these Day 2 cultures back into the shaker incubator (37°C and at 200-225 RPM) for O/N incubation. Next, we will measure the chromoprotein absorbance or fluorescence for your cultures (as is appropriate).
- From the remaining culture in the microcentrifuge tube, add 200 µl to a well in a 96-well plate.
- ***FOR FRI students: There will be a single plate being used each day (ask Dr. Mishler)
- Record what wells you will be pipetting into, and carefully add the 200 µl to just those wells.
- Avoid cross contamination by carefully and slowly pipeting out the culture.
- Return the plate to a mentor/Dr. Mishler, who will store it in the cold room.
- The plate will be read by Dr. Mishler or a mentor later, once all of the samples for the day have been added.
- Clean up your bench space and store your overnight cultures from the previous day in the cold room (FRI: on your groups shelf).
Day 3 → until completion
Repeat the procedure for Day 2, preparing new culture tubes with labeled with the respective days. Record the absorbance or fluorescence readings from the previous day as you did on Day 2. This data should be recorded online and in your notebooks. UT Box is our preferred storage area. Record how many generations passed between each day. After 7-10+ days, or after a time when the phenotype of the cultures visibly diminishes, you should stop carrying forward the overnight cultures. *FRI STUDENTS: You will want to check this with Dr. Mishler or a mentor prior to stopping. In general, we will want to see that the color has declined and stayed declined for at least 2 consecutive days. [[STOPPED HERE BY DR. MISHLER ON 12/15/2016. Will continue later from Riya's 2016 protocol. - Dr. M.]]] Day completion = Day X In consultation with Dr. Mishler, stop growing cultures once the color has significantly diminished.Procedure: Growth
- Plate the ancestral strain to isolate single colonies
-
 It is very important to start from brightly fluorescent single colonies so that any existing genetic variation in a stock culture is purged (which is very common for devices that lose function rapidly). Only in this case are the observed decay curves and breakage mutations evolutionarily independent!
-
- Pick entire single colonies from these plates and resuspend each one in a 10 mL culture in a 50 mL flask. These are your replicate cultures.
- It is important to get the entire colony, because then one can figure out exactly how many cell divisions have taken place from the single cell that initiated the colony.
- Each growth cycle (usually 24 h) transfer 100 µL of the overnight culture and into 10 mL of fresh media and either store the culture or immediately take a measurement (methods for this explained below).
- This 1000-fold dilution equals 10 generations of binary cell division.
Procedure: Measurement
Measurement by Plating
There are essentially two ways to do this by plating, either by spreading an inoculum across the whole plate or by spotting inocula as serial dilutions. Both involve counting colonies and the readout is the ratio of fluorescent colonies divided by the number of total colonies. Though spreading consumes a significantly higher number of plates, it also allows detection of smaller changes in fluorescence, as typically 30-300 colonies can be counted on such plates while only about 6-60 colonies can be counted during spotting.
Spreading
- Estimate the cfu/ml of the overnight culture via OD600 measurement. There is a web calculator available here. Note that to measure OD600 accurately you may have to dilute your culture as this is most accurate in the range of OD600 in the range of 0.1 to 1.0.
- After estimation, dilute the culture in saline by taking 100 μL, adding it to 10 mL of saline, vortexing, and repeating the dilution process as needed. The ultimate goal is to dilute the cfu/ml to a point where spreading 50-100 μL would yield about 30-300 colonies.
- Add sterile glass beads to LB agar plates with antibiotic, then place the appropriate amount of the diluted culture on the beads.
- Shake the plates back and forth to ensure that the inoculum is spread uniformly across the surface of the agar.
- Incubate at 37°C for 24 h.
- Count the total number of colonies overall. If desired, you may use a colony-counting software such as OpenCFU, but it may be easier to simply do it by hand. If you do decide to use such software, please double-check the automated counts to eliminate any false positives and false negatives.
- Count the total number of nonfluorescent colonies using blue light. Remember to place the orange filter on top and, if desired, wear the orange safety glasses.
- Now, to calculate the ratio, subtract the number of nonfluorescent colonies from the number of total colonies. This will yield the number of fluorescent colonies. Then divide by the total number of colonies.
- Plot the ratio as a function of time over several days. The expected result is a significant drop in this ratio over the course of a few days representing the decay of the genetic device.
Spotting
Note: This protocol was adapted from Thomas, Sekhar, Upreti, Mujawar, & Pasha (2015).A convenient flowchart of the protocol (though altered) can be found here.
- It is no longer necessary to estimate the cfu/ml of the overnight culture, as each plate is capable of enumerating colonies over a range of 6 orders of magnitude as opposed to the above method. Instead of diluting the overnight culture in 10 ml of saline, set up a serial dilution series of sterile microfuge tubes each containing 900 μl of saline. Each tube represents a tenfold dilution (and thus should be labeled -1, -2, -3, etc.) and I recommend diluting out to 10^-7. Contrary to what the paper advises, I do not recommend diluting the overnight culture to an OD600 of 0.1; it is unnecessary.
- Place 100 μl of the overnight culture into the microfuge tube representing 10^-1 and vortex. Please note that taking 100 μl from this would actually be a 10^-2 dilution (the overnight culture is first diluted tenfold after being added to the saline, then you only take 1/10th of the dilution to plate). This will be accounted for in the final formula to back calculate cfu/ml (if desired).
- Label your LB agar plates with antibiotic by dividing most of the plate into 6 sections. Each section of the plate will be used to spot a different dilution of the same culture. Thus, the six sections may be labeled -2, -3, -4, -5, -6, and -7, for example.
- Spot 10 μl of each dilution in triplicate onto the corresponding section of the plate. The paper recommends 20 ul but that seems to cause the spots to run into one another and it also takes longer to dry, increasing the chance for contamination.
- Dry out the plate in the 30°C or 37°C incubator with the lid slightly off to allow moisture to evaporate. This part can take 15-20 mins depending on temperature and how moist the agar itself is.
- Place the lid back on fully and incubate at 37°C for 24 h. The resulting plate should look like the example plate on the left here.
- Calculate the ratio of fluorescent to nonfluorescent colonies.
- Plot the ratio as a function of time over several days.
Expected Results
Both spotting and spreading yield the same output in terms of data, that is, fluorescence is presented as a proportion of fluorescent colonies over total colonies as a function of time. This data should thus be presented as a scatterplot. Furthermore, fluorescence by these measurements is highly stable; after three weeks, over 90% of the colonies seem to remain fluorescent (at least in preliminary tests). Here is example output graphed via ggplot2 in R: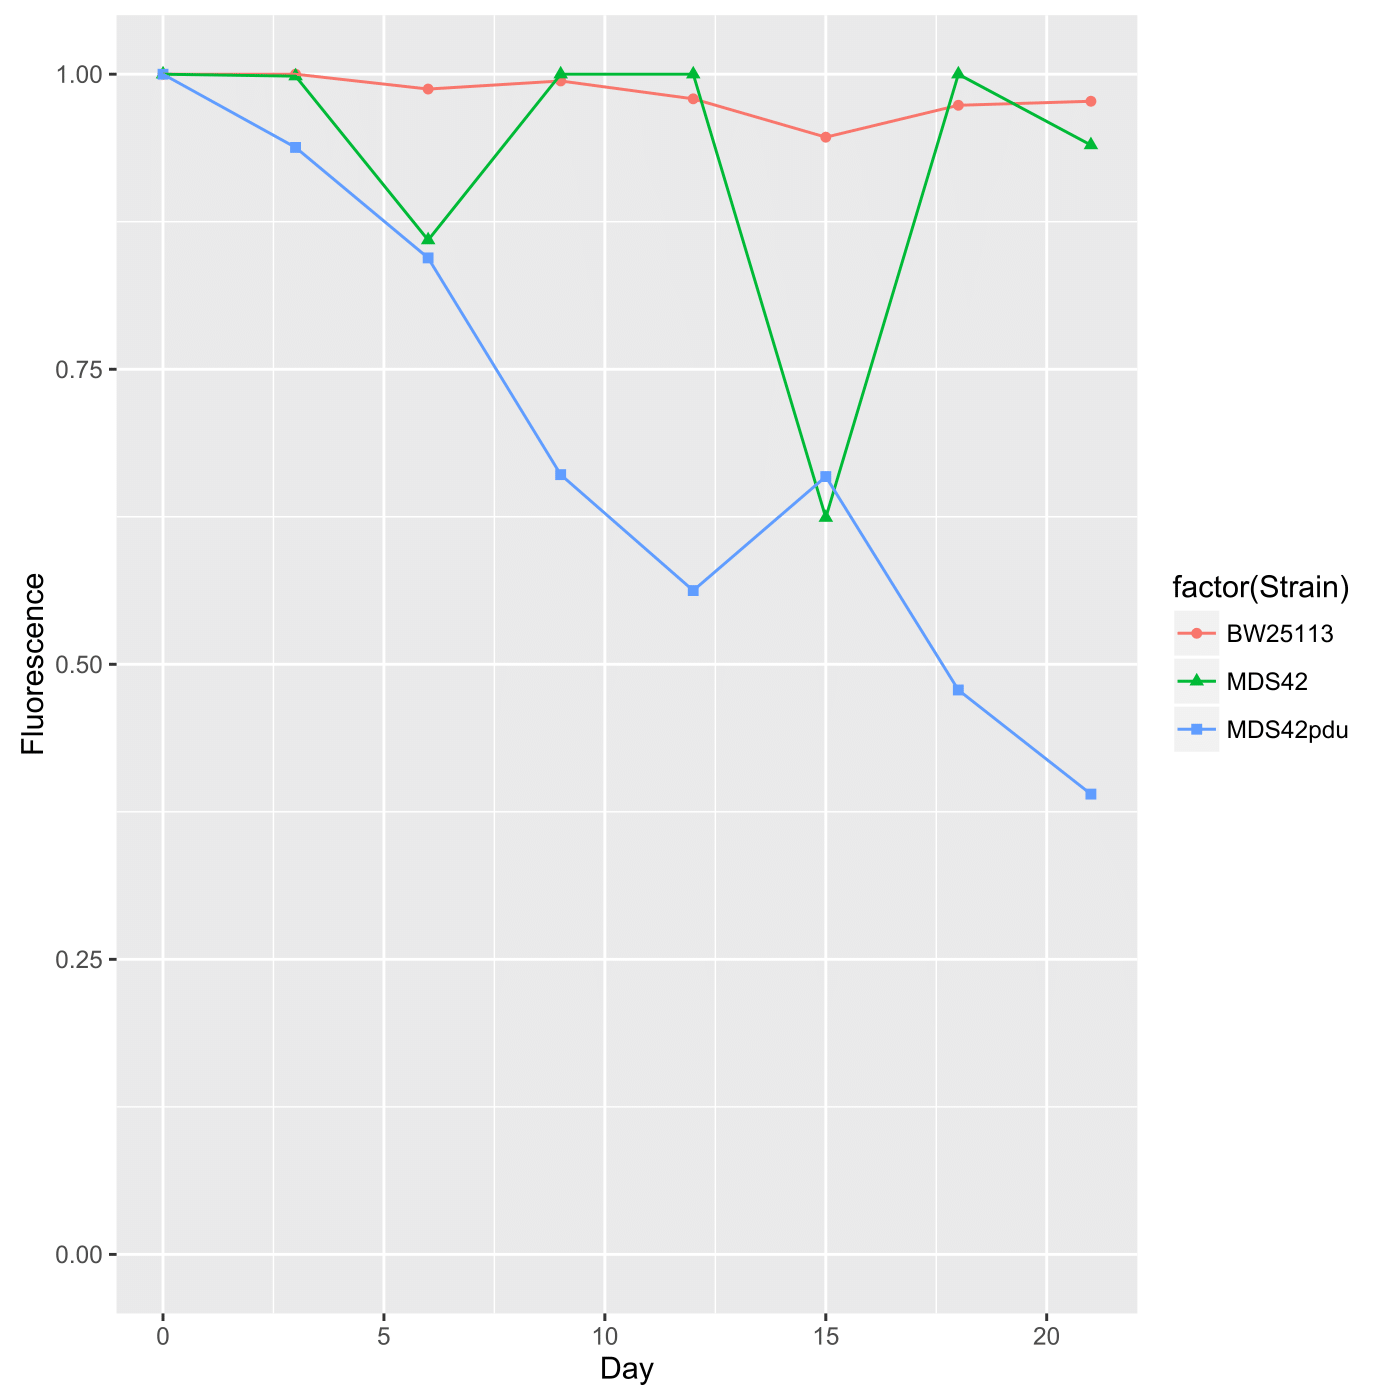 This was generated via the following code in the terminal using R (v. 3.2.3), which has been commented so that you may use it as a backbone if you are unfamiliar with R:
install.packages("ggplot2")
This was generated via the following code in the terminal using R (v. 3.2.3), which has been commented so that you may use it as a backbone if you are unfamiliar with R:
install.packages("ggplot2")#If you are running ggplot2 for the first time, take note that it is not included automatically when you install R; thus it must be installed manually.
library("ggplot2")
#ggplot2 is not loaded by default when you start up R; this is the standard way of loading it.
data <- read.csv("yourfilename.csv", header = TRUE, sep = ",")
#This reads your input file and deposits it into 'data', given that the data points are separated by commas and that there is a header of column names.
ggplot(data, aes(x = Day, y = Fluorescence, color = factor(Strain), shape = factor(Strain))) + geom_point() + geom_line() + ylim(0, 1.0)
#This invokes ggplot2 and graphs fluorescence (y) as a function of time (x).
#Points on the graph can color-coded (color = factor(Strain)) and shape-coded (shape = factor(Strain)) for clarity if your data points originate from different samples. Since fluorescence here is represented by a proportion such that 0 ≤ y ≤ 1, ylim(0, 1.0) sets the boundaries of the y-axis.
For more guidance on R, helpful resources can be found for aesthetics and formatting of axes.
Troubleshooting:
- The incubation period is around 24 h because colonies that are too small may not appear fluorescent (even if the genetic device is intact) and thus act as false negatives. However, growth rates can vary and you should check on colony growth before 24 h if colonies have grown too large and start to overlap.
- Fluorescent colonies can stay fluorescent for a couple of weeks in the fridge, so feel free to store them at 4°C and count them later if desired.
- If there is large variation between technical replicates, ensure you are vortexing for a few seconds after every dilution step.
- While drying the inocula during the spotting method, even though the plate is somewhat open and exposed for a period of time, it is unlikely that you will get any contamination. If this turns out to be a problem, you may also dry your plates in a biosafety cabinet which will take longer due to lower temperature but reduce the risk of contamination.
Measurement by Microplate Reader
- Plan out which wells will contain what sample. You can print out one of the 96 well plate templates available online. Generally, each condition should be done in quadruplicate (or triplicate depending on space concerns).
- After vortexing your sample, aliquot 100μL at a time into each well. You should use the appropriate type of plate for your application: black walled, clear bottom for fluorescence (white walled, clear bottom is generally for luminescence and completely clear is generally for other applications, like measuring OD600).
- Ensure that you have adequate controls. At the very least, have a nonfluorescent negative control of E. coli in the same media grown under the same conditions, either empty vector or isolated from a colony that had lost its fluorescence.
- Turn on the plate reader - there is a power button in the back next to the power cord - and then turn on the Magellan software on the computer next to it. Not doing it in this order may cause the software to fail to recognize the machine.
- Select the option that says "raw data" and eventually you will find yourself at a configuration screen.
- First, select the brand and type of your plate next to the "Plate definition" dropdown menu.
- Second, using ctrl click, select the wells you want to measure.
- Third, you must add a measurement step. Double click "Fluorescence Intensity." Set your Excitation and Emission values to integers appropriate for your fluorophore and change Gain to "Optimal". You can also manually set gain by testing different values: generally, a higher gain detects smaller amounts of fluorescence; if you get overflow reads in several wells, you should set the gain lower.
- Fourth, perform the measurements and save your data. Unfortunately, there is no Excel installed on that computer, so "Copy to Excel" is not a possibility at this point. Data is saved by default as ".wsp" files. (Still looking for a workaround - there is also a "Copy as ASCII" option that I haven't tested yet).
- Finally, after performing this over a number of days, calculate how RFU changes as a function of time. Remember to normalize RFU to OD600, as a higher number of cells will naturally fluoresce more brightly than a lower number of cells given that both of the populations have the same proportion of fluorescent cells.
Troubleshooting:
- If you are not sure what the excitation/emission values for your fluorophore are, here is a handy reference courtesy of Simon: Spectra of Common Fluorophores.
- You can BLAST the gene sequence of your fluorophore to check which it matches (most likely a variant of EGFP). If you are still not sure or getting bizarre results, you may want to do a "Fluorescence Intensity Scan" where you set the plate reader to test numerous wavelengths of excitation in a certain range and then look at the spectra to see where the peaks (highest RFUs) are, in terms of wavelength.
Measurement by Flow Cytometry
Note- E. coli fluorescence seems to be relatively stable for up to ~7 days at 4°C in these measurements.
- Aliquot 100uL of cells into 1.5 mL tubes, add 1 µL of FM 4-64 membrane dye
- Incubate cells + dye for 10 min, shaking at 37°C.
- Spin cells down for 5 minutes at 3000 rpm.
- Remove media and resuspend with an equal volume of saline or PBS.
- Proceed to using Flow Cytometry to count, see protocols described in Generic flow cytometry guidelines
- After fluorescence has been assayed, plot the %FP over the number of days
Authors and Acknowledgements
- Lucy LeBlanc
- Dr. Dennis Mishler
- Riya Sreenivasan (for BCP data and initial protocol draft)
Barrick Lab > ProtocolList > ProtocolsFluorescentProteinEvolutionaryStability
Topic revision: r11 - 2018-03-22 - 19:37:19 - Main.JeffreyBarrick