<<Return to qPCR page
 (Numbers are PCR product dilution with "10" representing a 1:10 dilution of your 0.01ng/ul PCR product prepped as described above)
Template Material
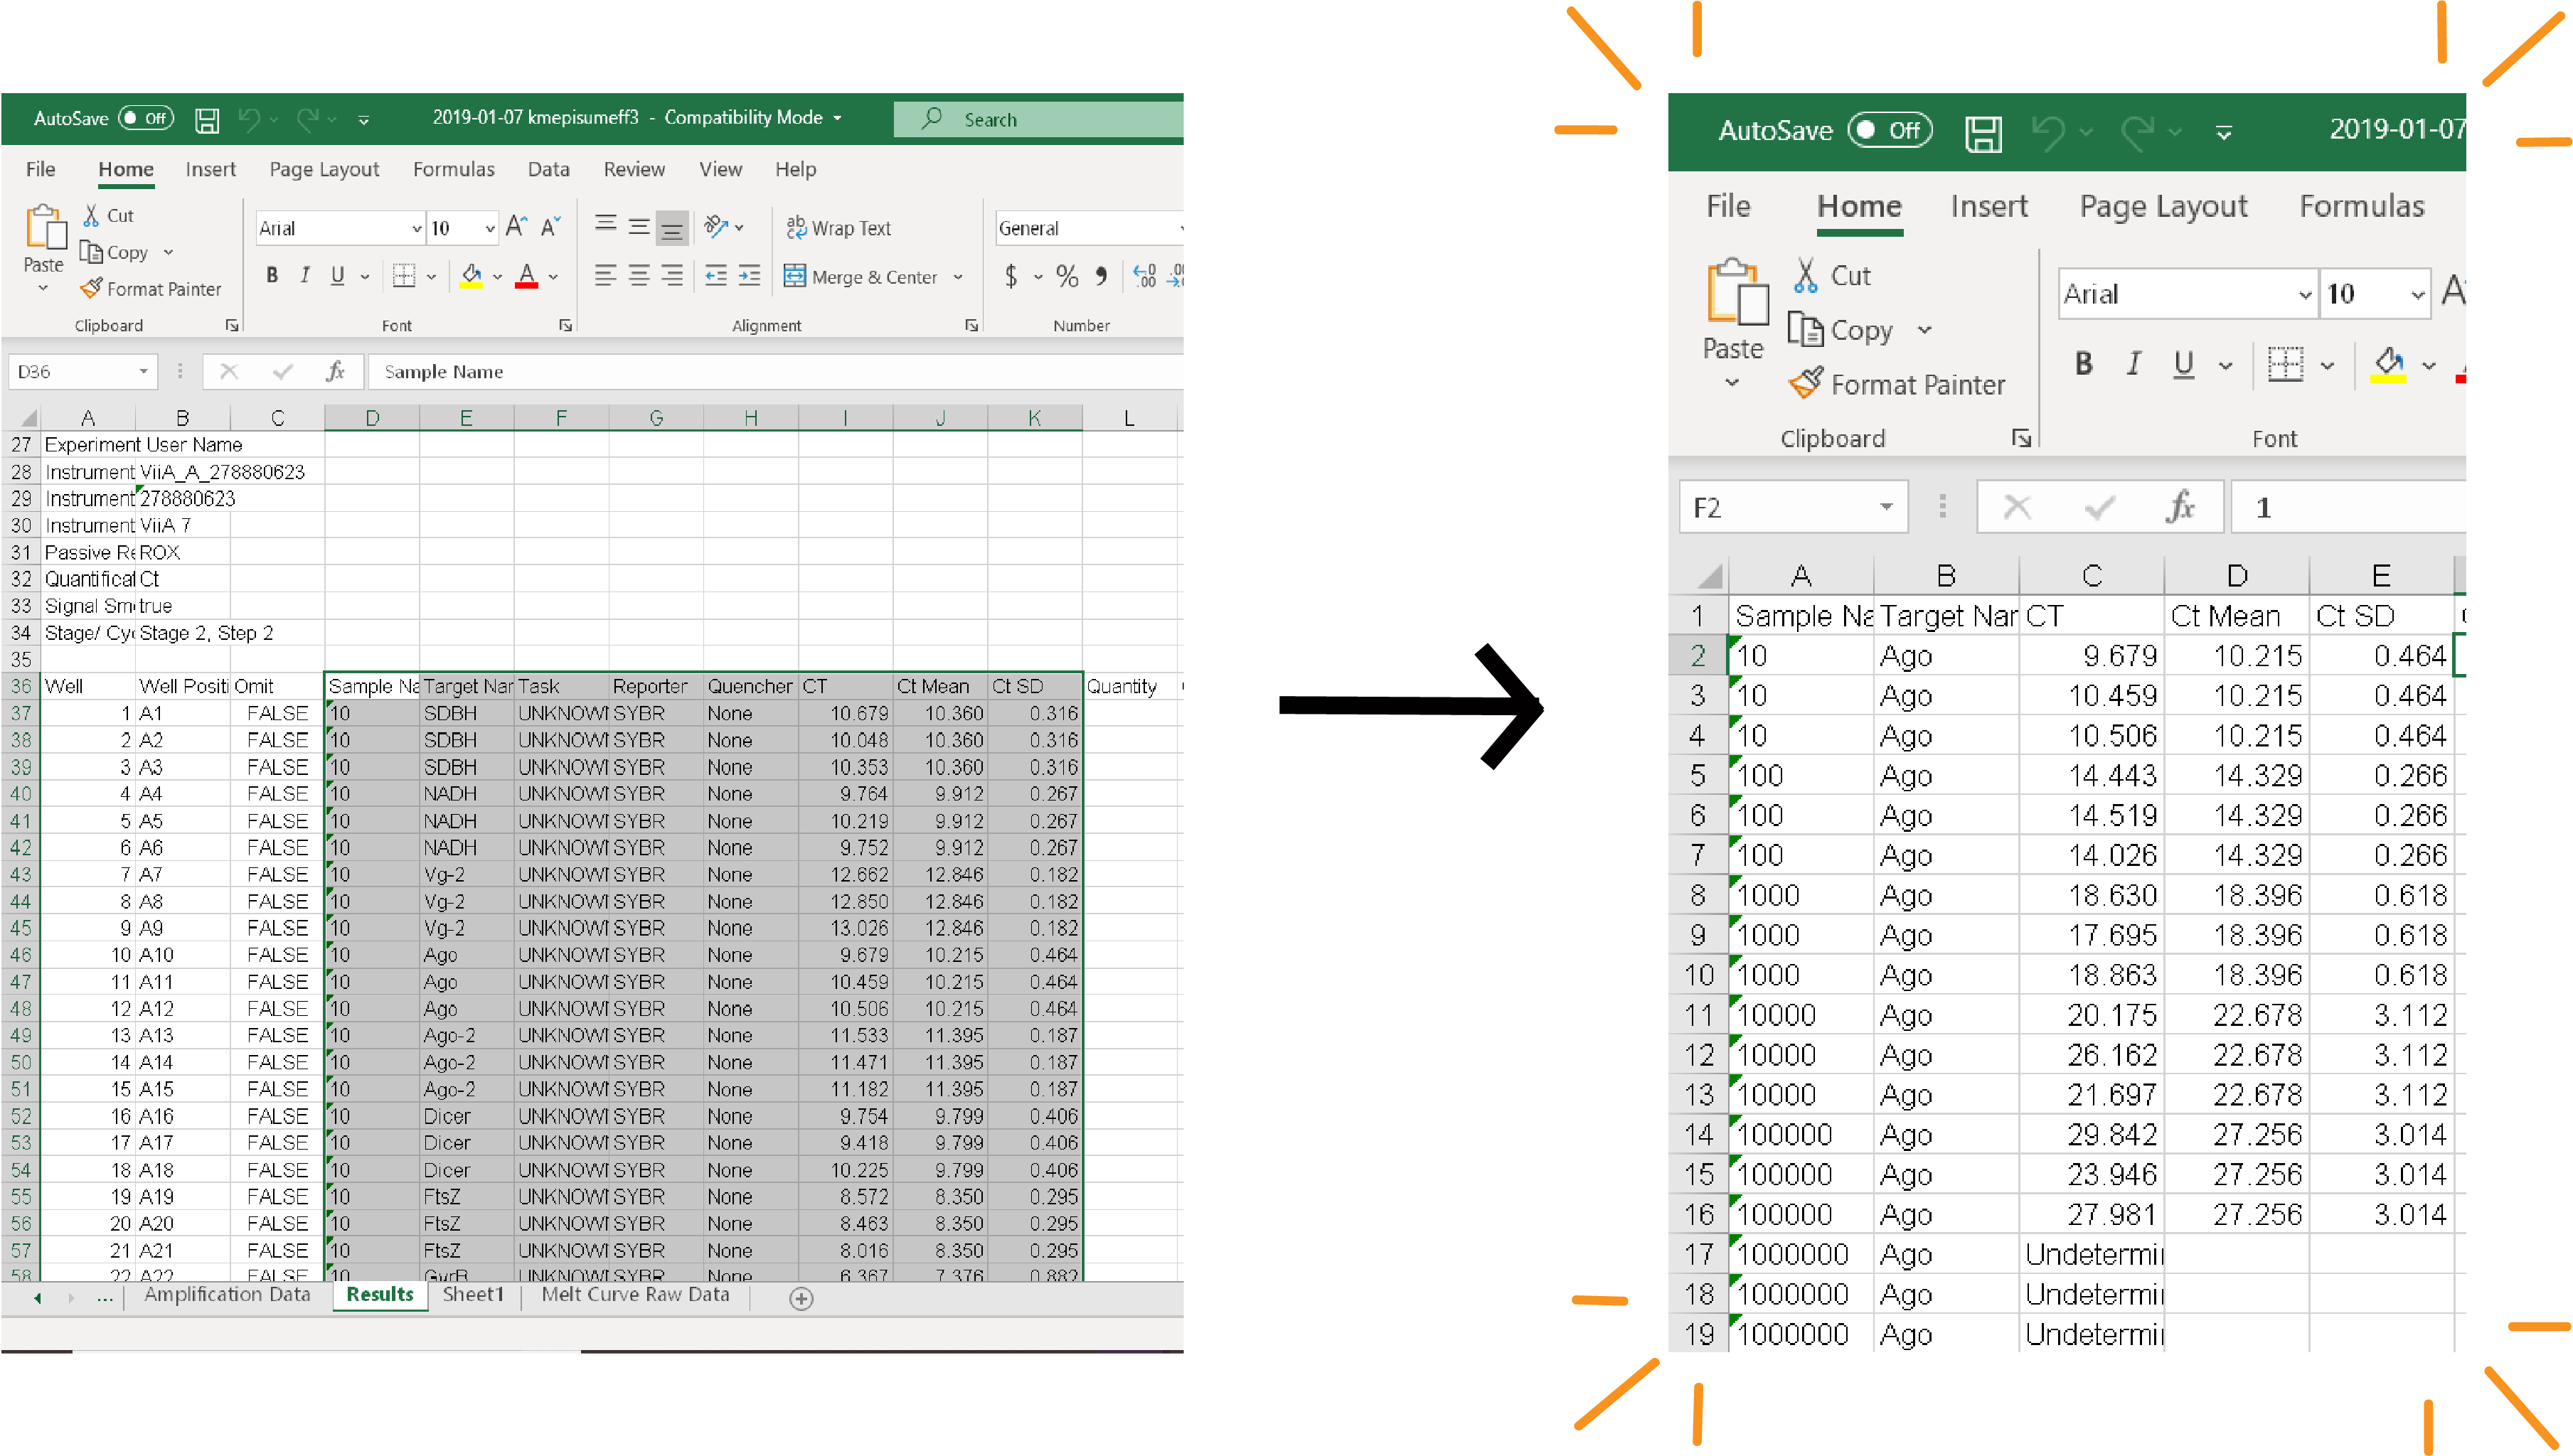
Your data is likely in an ugly format. I would recommend rearranging it (keep all that raw data though!!!!!) as shown below: (Copy over the Sample and Target Name, CT, CT Mean, and CT SD columns and rearrange so that they're grouped by target)
Step 2: Calculate the linear regression equation for each target.
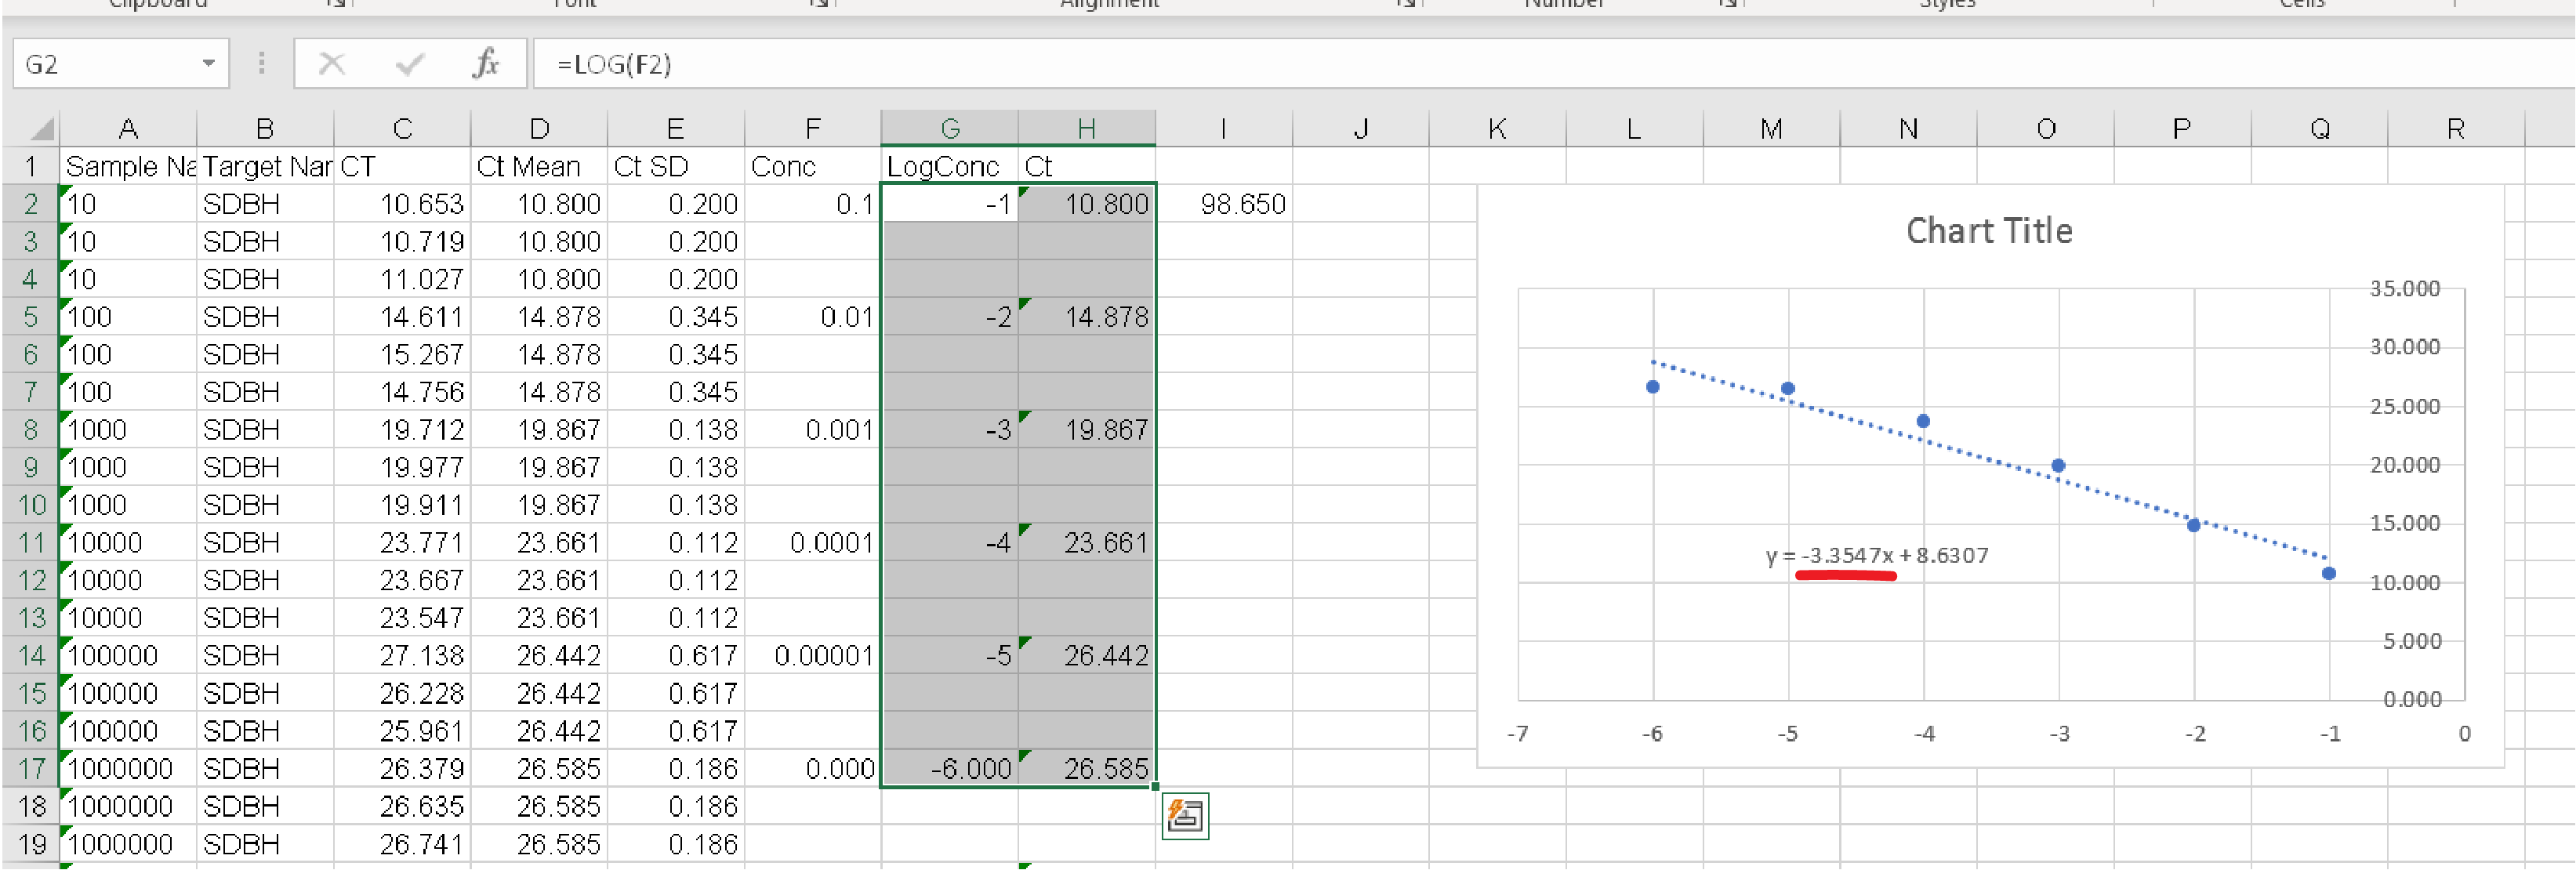
1. Calculate the Log Concentration of your samples (if your sample is 1:10 then the Concentration is 0.1 and the Log Concentration is -1)
2. Using Excel create a plot where the Log Concentration is on the x-axis and the Mean Ct for your 3 technical replicates is on the y-axis. Display the linear regression formula on the chart.
 Step 3: Calculate your Primer Efficiencies.
Plug your slopes into this CALCULATOR and CONGRATULATIONS you've got primer efficiencies!
You want to achieve primer efficiencies between 90 and 110%. If your primers are not within that range it is most likely an error with this qPCR reaction. When the standard deviations between samples are wide it really throws off this calculation. Did you perhaps let something slide from the "What you are looking for" category that you shouldn't have? You may have to repeat this reaction again. If your results have been extremely clean however, you should redesign your primers. <<Return to qPCR page -- Main.KateElston - 21 Mar 2019
Primer Efficiency qPCR
Goals- Test that primers work
- Determine the efficiency with which your primers bind to your target (This will be important when you do your final analysis)
- The template for this qPCR will be the PCR product of each of your target genes. So before you get started you will need to perform PCR off of either genomic DNA or cDNA (this depends on how you designed your primers)
- Run your PCRs like you normally would (use a 60C annealing temperature). This can be the same reaction as your primer valdation.
- PCR purify your product and then dilute to a concentration of ~ 0.01ng/ul (trust me...it seems low but it works!)
- Now you're good to go ahead and set up your qPCR reactions!
 (Numbers are PCR product dilution with "10" representing a 1:10 dilution of your 0.01ng/ul PCR product prepped as described above)
Template Material
- Use PCR product as your template for this one!
- Technical replicates with a standard deviation below 0.2 (this is especially important for this step because when your standard deviations are high you'll calculate inaccurate primer efficiencies - this qPCR step is thus nice to do first because it's good practice for getting those SDs low without wasting your precious biological samples)
- Ct values for the entire range of these dilutions. If any of the extremes (1:10 or 1:100,000) are "Undetermined" you may want to increase or decrease the dilution of your PCR template (I recommended an initial concentration of 0.01ng/ul, but if this does not work for you adjust it as needed!). You need to have a range of values that stretch over 6 10-fold dilutions to get a good calculation of primer efficiency. It's also ideal that all the Ct values fall within the dynamic range of 13-30; sometimes values that fall out of that range will skew your data and mess with your efficiency calculation.
Analysis
As long as you have met the criteria that I laid out above you're good to move on to calculating your primer efficiencies. Step 1: Rearrange your data.Your data is likely in an ugly format. I would recommend rearranging it (keep all that raw data though!!!!!) as shown below:
 (Copy over the Sample and Target Name, CT, CT Mean, and CT SD columns and rearrange so that they're grouped by target)
Step 2: Calculate the linear regression equation for each target.
 1. Calculate the Log Concentration of your samples (if your sample is 1:10 then the Concentration is 0.1 and the Log Concentration is -1)
2. Using Excel create a plot where the Log Concentration is on the x-axis and the Mean Ct for your 3 technical replicates is on the y-axis. Display the linear regression formula on the chart.
 Step 3: Calculate your Primer Efficiencies.
 Plug your slopes into this CALCULATOR and CONGRATULATIONS you've got primer efficiencies!
You want to achieve primer efficiencies between 90 and 110%. If your primers are not within that range it is most likely an error with this qPCR reaction. When the standard deviations between samples are wide it really throws off this calculation. Did you perhaps let something slide from the "What you are looking for" category that you shouldn't have? You may have to repeat this reaction again. If your results have been extremely clean however, you should redesign your primers. <<Return to qPCR page -- Main.KateElston - 21 Mar 2019
Barrick Lab > ProtocolList > QPCR > PrimerEfficiencyqPCR