Measuring Microbial Growth Rates in a Plate Reader
The following protocol can be used to determine the growth rate of a bacterial culture using a plate reader by measuring the optical density (OD600) of the culture over time. This protocol is written specifically for a Tecan Infinite® M200 Pro plate reader combined with the Magellan data analysis software and thus may require alteration for other machines. The Nunc MicroWell 96-Well Optical-Bottom Plates (black wells with clear bottoms) are ideal for this assay. Some considerations:- You can reduce variation in measurements by using well-specific blanks (Atolia et al. 2020).
Program set-up
The parameters used by the Barrick Lab are:- Temperature: Appropriate for growth of your organism
- Kinetic Cycle:
- Duration: 16-24 hours (as appropriate for your experiment)
- Kinetic interval: every 10 minutes
- Orbital Shaking: 420 seconds at amplitude 3
- Wait: 5 seconds
- Absorbance reading: 600 nm, 25 flashes, 50 ms settle time
Reviving cultures (2 days before experiment)
1) Inoculate an overnight culture of each strain being tested. Prepare a separate tube of uninoculated media as a control for contamination. Incubate overnight.Preconditioning cultures (1 day before experiment)
Preconditioning acclimates the strains to the media. Additionally, on this day you should pre-warm your media as it takes a long time for the plate reader to warm up media. Not doing this will lead to inconsistent lag time. 2) Inoculate 5 μl of each overnight culture into fresh media to precondition. Prepare a separate tube of uninoculated media as a control for contamination. Incubate overnight.3) Place the media you will use for the assay in an incubator at the correct growth temperature overnight to pre-warm.
Growing cells in plate reader and measuring OD600
All strains tested should have at least have 3 replicates, although more replicates should be performed as long as there is available space on the plate. Evaporation can occur in the outermost wells, so if there are few enough samples the outer ring of wells should be skipped. Due to small variations in temperature throughout a 96-well plate, best results will be obtained if replicates are distributed randomly across the plate. 4) Begin heating the plate reader to the desired growth temperature using the Temp. control... button in the Start Measurement dialog box.- The plate reader needs to be turned on before the computer is booted up to allow the computer to recognize it.
6) Inoculate each test well with 5 μl of overnight culture.
7) Place the plate into the plate reader. The lid can be removed (we've had no problems with contamination, as seen on wells with LB blanks, with this).
8) Start your program.
9) Once the program has finished, export the data as an Excel spreadsheet.
- To export data in Magellan you must first click on the "Data Export" tab, check the "Raw data" box, and then click the right-facing arrow to move "Raw data" to the export column. Then you can select "Export to Excel" from the "File" drop-down menu.
Formatting the data
In order to run Growthcurver, you need to create a tab-delimited file in the following arrangement (see example file below):- Column 1, "time": The time each measurement was taken.
- Column 2, "blank": an average of the blank measurements at each time point.
- Columns 3+: the measurements from each sample at each time point, one column per well.
- growth_data_example.tsv: Example Growthcurver input file
Fitting growth curves with Growthcurver in R
Growthcurver is an R package that analyzes the optical density data by fitting it to a logistic function from which the growth rate, doubling time, and carrying capacity can be calculated. Growthcurver can be installed with the command:
install.packages("growthcurver")
Growthcurver can be run on the formatted tab-delimited file with the following code. The variable "r" contains the growth rate and is extracted once the model has been fit to the data. Note that the units of the growth rate will be based on the units of your file, i.e. if your time is in seconds and the growth measurements are in OD600 the growth rate will be expressed in OD600/second and may need to be converted to other units.
library("growthcurver")

#import data
growth = read.table("/path/to/your/file/data.tsv", header=T, sep="\t", stringsAsFactors=F)

#calculate growth rate
gc_out = SummarizeGrowthByPlate(growth, bg_correct="blank")
gc_out$r
Quality control can be performed by checking for notes on the model fitting. Any samples with low quality fits will be identified by the following code:
library("dplyr")
gc_out %>% filter(note != "")
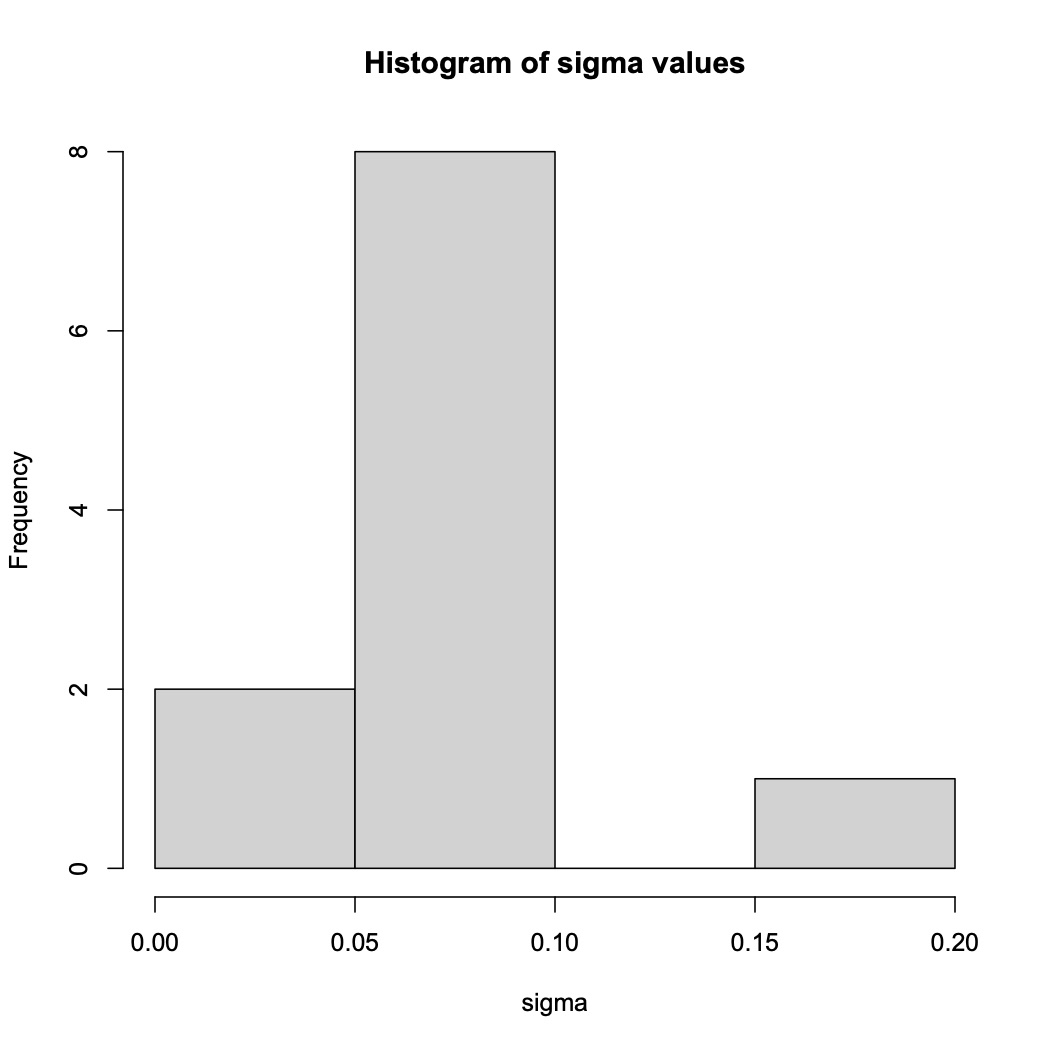
Other statistics that can be reported include the carrying capacity (use gc_out$k), the doubling time (gc_out$t_gen), and the inflection point of log phase (gc_out$t_mid) for each sample.Additionally, a histogram of the variance of the data can be produced with the following code. Poorly fit samples will appear as outliers on the histogram as in the example below.
gc_out = as_data_frame(gc_out)
hist(gc_out$sigma, main="Histogram of sigma values", xlab = "sigma")
Calculating growth rates using the Grofit R package
Growth curves can also be fit using Grofit, however this package is no longer supported by the current version of R.References
- Growthcurver publication: https://link.springer.com/article/10.1186/s12859-016-1016-7
- Growthcurver manual: https://cran.r-project.org/web/packages/growthcurver/vignettes/Growthcurver-vignette.html
- Atolia, E. et al. Environmental and Physiological Factors Affecting High-Throughput Measurements of Bacterial Growth. mBio 11, e01378-20 (2020). https://doi.org/10.1128/mbio.01378-20
Contributors
- Isaac Gifford
- Julie Perreau
- Gabriel Suárez


| I | Attachment | History | Action | Size | Date | Who | Comment |
|---|---|---|---|---|---|---|---|
| |
growth_data_example.tsv | r1 | manage | 11.7 K | 2021-11-05 - 16:45 | IsaacGifford | Example Growthcurver input file |
Barrick Lab > ProtocolList > ProtocolsGrowthRates