DNA Concentration Determination
For many applications in cloning and genome editing, it is critical to accurately measure the concentration of DNA in a sample. This page explains the most commonly used methods for measuring DNA (or RNA) concentrations and discusses the advantages and disadvantages of each one.Overview
| Method | Qubit | NanoDrop | Gel Electrophoresis |
|---|---|---|---|
| Typical Range | dsDNA BR: 1-1000 ng/µl dsDNA HS: 0.05-60 ng/µl |
5-3000 (ng/µl) | 30-125 ng |
| Advantages | Most accurate; robust to contaminants | Quickest; Largest dynamic range; Works for both ssDNA and dsDNA samples | Robust to contaminants; Can detect mixed DNA species and determine the concentrations of multiple DNA species in a mixture |
| Disadvantages | Requires 2 point standard curve to measure even one sample; Only accurate for dsDNA with typical kits used | May significantly overestimate concentrations if a sample has multiple DNA species or high levels of other chemicals, including salts | Most time consuming; Low dynamic range and sensitivity |
Qubit 4 Fluorometer
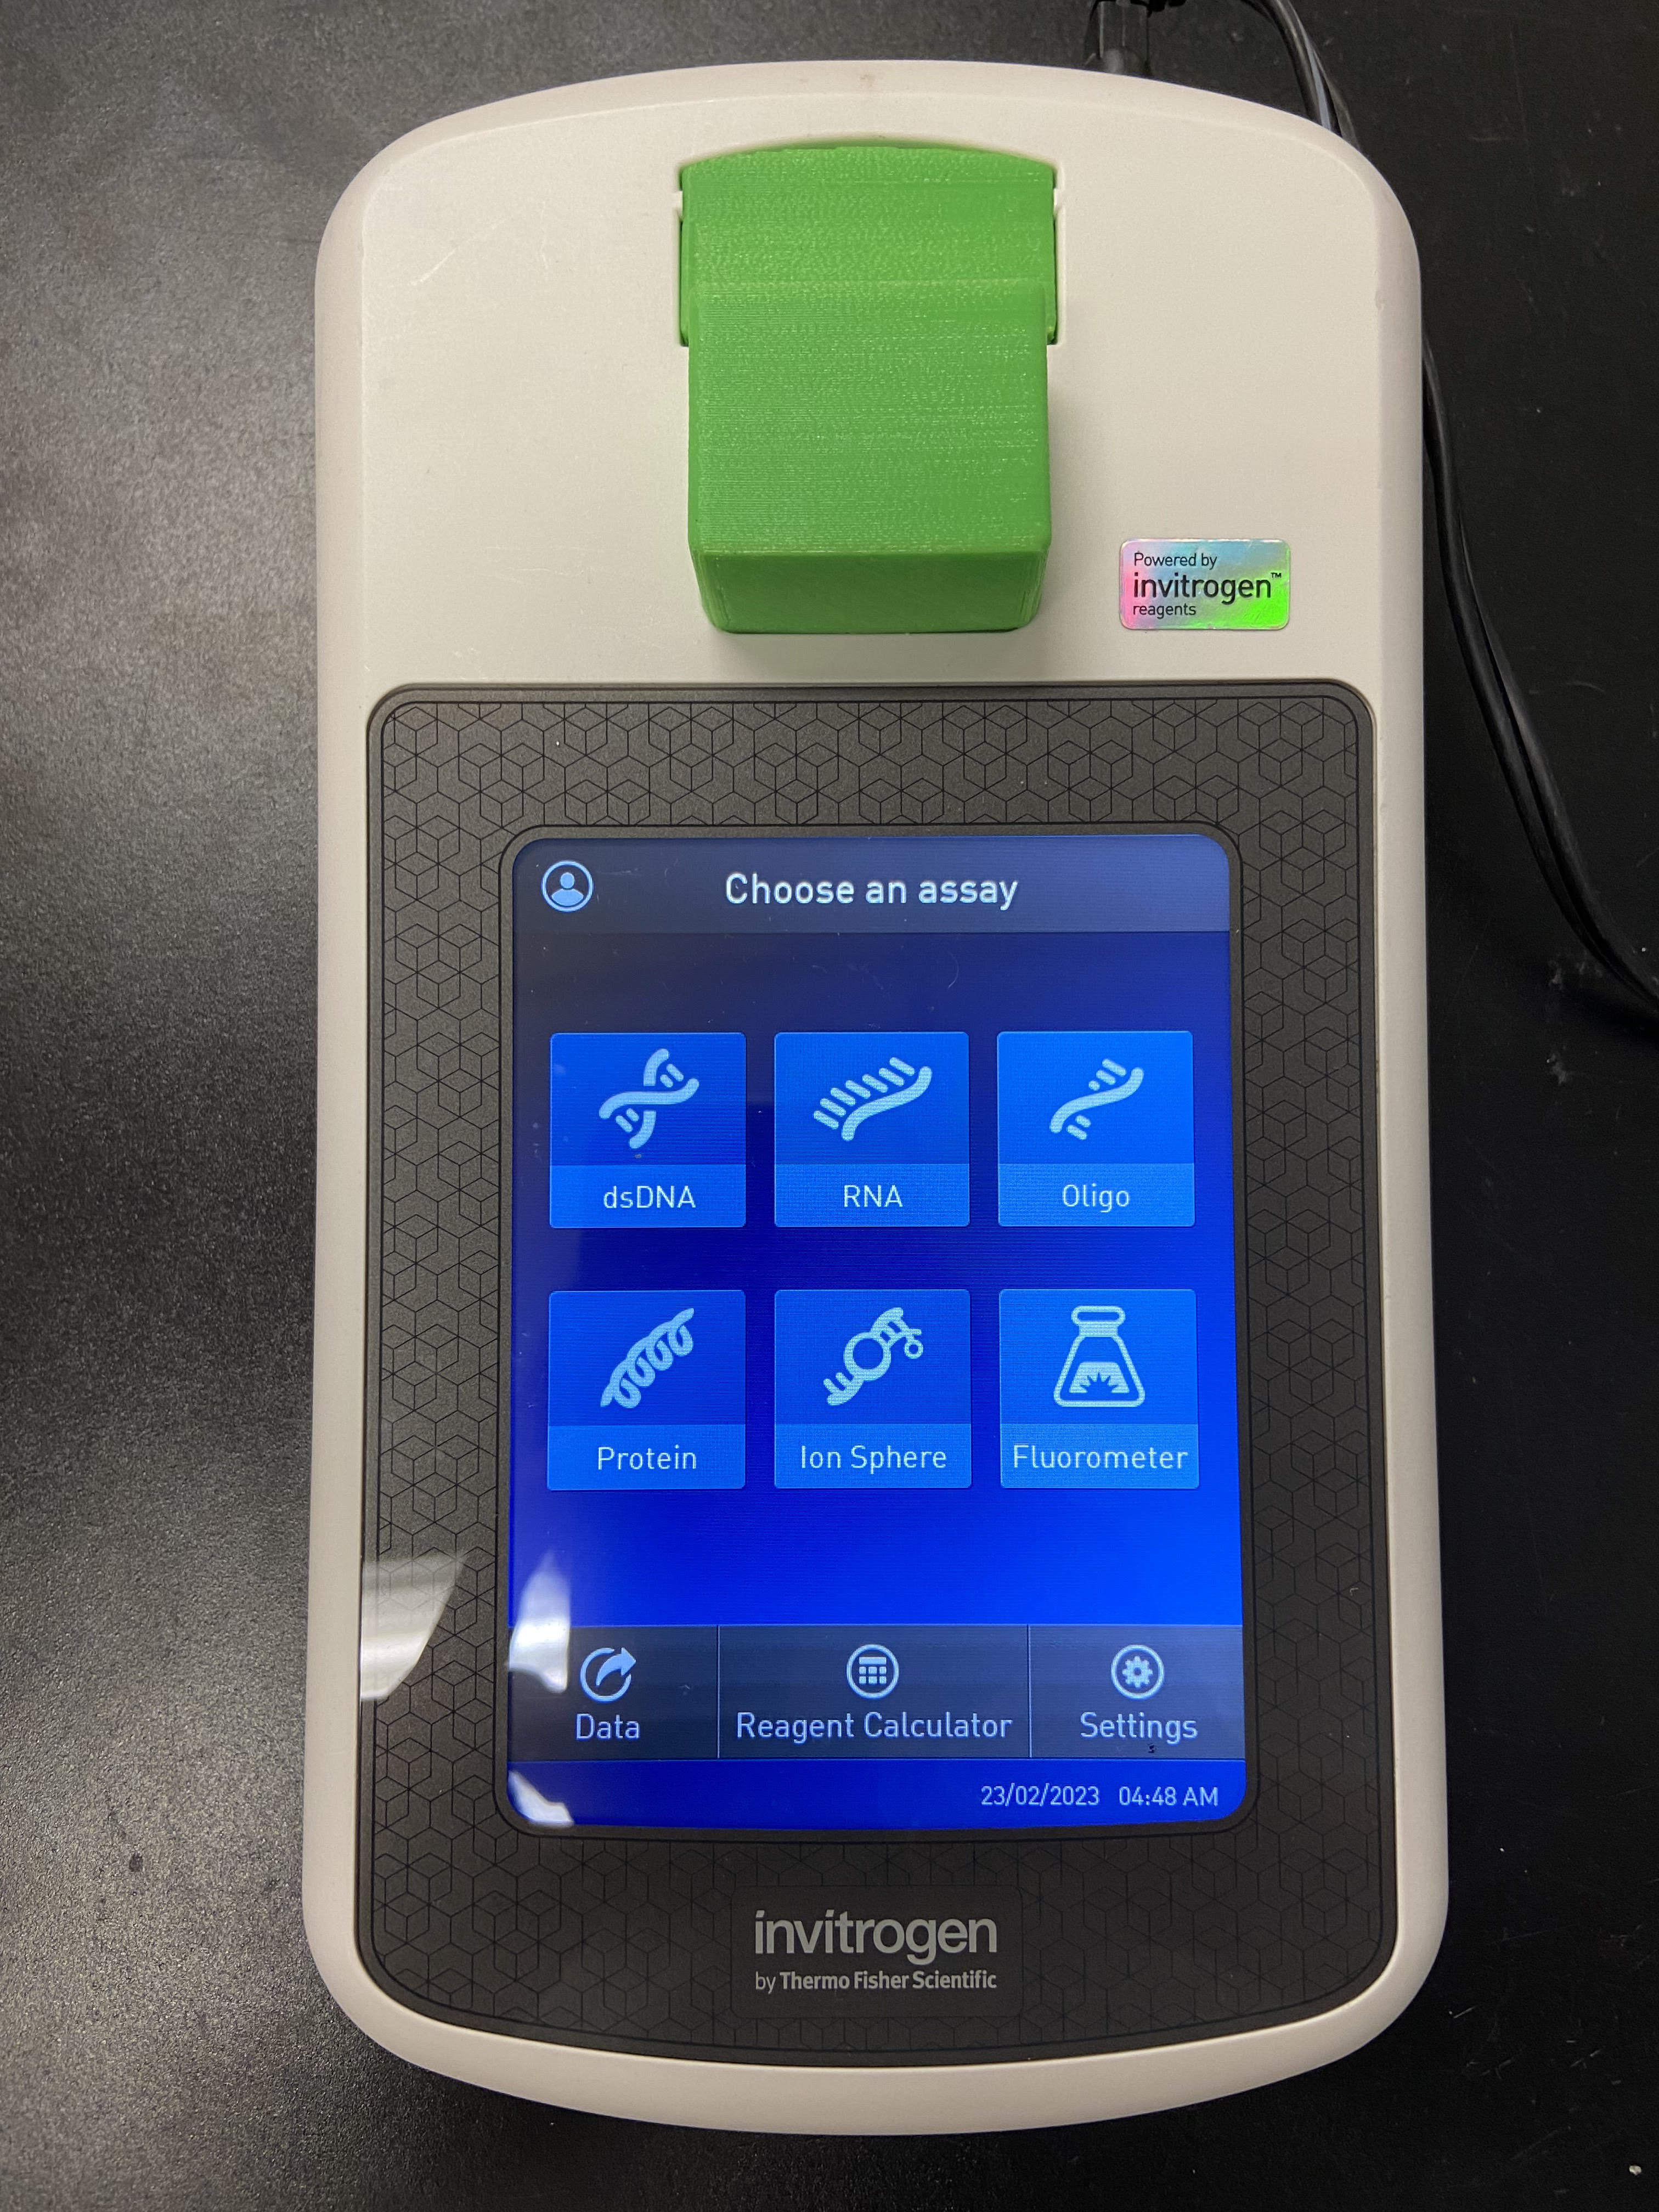
- We have a Qubit 4 unit in the MBB lab.
- You have double-stranded DNA.
Other Qubit kits must be used to accurately determine the concentrations of single-stranded DNA or RNA because they interact with the fluorescent dyes differently. - From 1 to 20 µl of DNA sample is required, with 2 µl being the amount typically used by the lab.
- Main Qubit Instrument and Assay Page
- Link to the Qubit manual
- Video discussing the advantages of the Qubit and how to perform an assay (from Thermo Fisher)
DNA BR (Broad Range) Protocol
- With this assay, the instrument can read diluted concentrations between 10 pg/µl and 10 ng/µl.
- Maximum detection window: 0.1 ng/µl to 2,000ng/µl (with decreased confidence above 1,000 ng/µl) for 20µl and 1µl sample respectively.
- Typical detection window: 1 ng/µl to 1,000 ng/µl (with decreased confidence above 500 ng/µl) for 2µl of sample.
- Make working stock by diluting 1µl of BR dye into 199µl dsDNA BR Buffer for each sample and standard.
- be sure to make enough working stock for all your samples plus 2 standards.
- Aliquot 190 µl working stock into Qubit tubes for both standards.
- Aliquot 198 µl working stock into Qubit tubes for each sample.
- Add 10 µl of appropriate standard to each standard tube. Briefly vortex after adding.
 Should be done before samples to ensure at least 3 minute incubation at RT
- Add 2 µl of each sample to each sample tube. Briefly vortex after adding.
- On the instrument home screen, select dsDNA, and then dsDNA Broad Range.
 If intending to transfer data to memory card, it is best to clear the data first by selecting data on the bottom right and then clear data.
- Follow on-screen instructions to read both standards and first sample.
Temperature affects the assay, so avoid warming the tubes by holding them excessively in your hands prior to placing them in the instrument, and select 'read' quickly after - Before reading the first sample select your sample volume, and output units.
- Continue reading all samples.
- If transferring to memory card, select Data from bottom left, and then export on the bottom right. Proceed to select your data and then press export again, and select your transfer method.
Biotium AccuGreen DNA BR (Broad Range) Protocol
* Unlike the Invitrogen Qubit dsDNA BR Assay Kit, the Biotium AccuGreen BroadRange dsDNA Quantitation Kit premixes the dsDNA BR dye with dsDNA BR buffer. All kit components are stored at 4°C. The Solution is also stable for storage at room temperature for at least 6 months if protected from light. The QuantitationSolution is a potentially harmful chemical. Please be attentive when you are handling it. The AccuGreen Broad Range dsDNA Quantitation Kit assay on the Qubit fluorometer is linear between 2 and 1000 ng of dsDNA per assay, which corresponds to sample concentrations of 0.2 ng/uL to 100 ng/uL. However, samples even slightly below 0.2 ng/uL will return the error message Out of Range. Therefore for best results you should use samples above 0.2 ng/uL.- Warm all components to room temperature before use. You can place all kit components in a 37°C water bath for rapid warming; be sure to allow solutions to cool to room temperature before using.
- For each sample and standard, pipette 190 uL of the Quantitation Solution into a clear 0.5 mL PCR tube (if using the Qubit fluorometer).
- Into one tube, pipet 10 uL of AccuGreen Standard 1 (0 ng/uL).
- Into a second tube, pipet 10 uL of AccuGreen Standard 2 (100 ng/uL).
- Pipette 10 uL of each DNA sample to be quantified into its own tube.
- Incubate the tubes at room temperature for at least 2 minutes.
- Turn on the Qubit instrument. On the home screen select dsDNA. Choose the Broad Range assay.
- Follow the prompts on the screen, and first read the AccuGreen Standard 1 and then the AccuGreen Standard 2. The program will use these values to quantify your unknown samples.
- One at a time, measure each of your samples.
- The data can be recorded manually or exported as a CSV file.
DNA HS (High Sensitivity) Protocol
- With this assay, the instrument can read diluted concentrations in the range 1-500 pg/µl.
- Maximum detection window: 0.005 ng/µl to 120 ng/µl (with decreased confidence below 0.01 ng/µl and above 100 ng/µl) for 20µl and 1µl sample respectively.
- Typical detection window: 0.05 ng/µl to 60 ng/µl (with decreased confidence below 0.1 ng/µl above 50 ng/µl) for 2µl of sample.
- Same protocol as BR, just substitute HS dye, and dsDNA HS buffer for the working stock, and be sure to use the HS standards instead of the BR standards
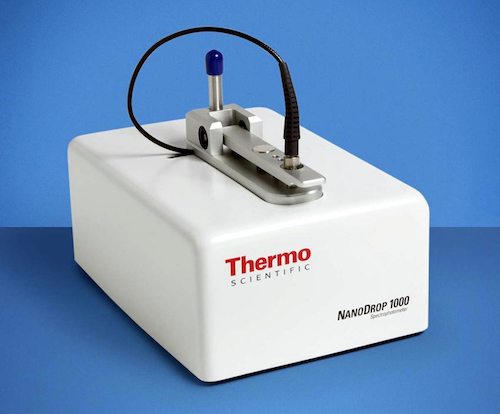
NanoDrop (or other UV Spectrophotometer)
- DNA Sequencing Core (MBB) Login information is your personal EID and password.
- 1 µl of sample required, capable of determining concentration between 5 ng/µl and 3,000 ng/µl according to manufacturer
- 1 µl vs 2 µl of sample does not seem to make a difference in readings
- Concentration determination by NanoDrop may be affected by salts, solvents, and proteins present in the sample.
- Looking at 260/280 (nucleic acid to protein) and 260/230 (nucleic acid to salt) ratios can give idea of contamination from these sources, but ratios only indicate problem.
- For a pure DNA sample, one expects a ratio of 1.0:1.8:1.0 for the 230:260:280 nm measurements.
- If a sample has a very poor 260/230 ratio (<1.0) then you may be greatly overestimating the concentration of your DNA because the "tail" of the salt reading will overlap and "swamp" the reading corresponding to nucleic acid at 260 nm.
- Expect these concentration calculations to be accurate to within ~20%. The theoretical extinction coefficients are only accurate to within this range. Furthermore, these calculations generally assume that the nucleic acid molecule is completely unstructured (extended). Base stacking leads to a decrease in OD260 (hypochroism). Although rarely done in practice, to make highly accurate measurements, one would want to resuspend the sample in 12 M urea or otherwise completely denature it.
General UV Spectrophotometer Nucleic Acid Quantitation Protocol
- Determine the theoretical extinction coefficient (ε) at 260 nm (OD260) of your nucleic acid sequence in units of M1 cm1:
- For short oligonucleotides, extinction coefficients can vary quite a bit depending on exact base sequence. It is best to use the calculator at IDT to get a more accurate value for your sequence that reflects its composition and some nearest-neighbor base effects. Concentrations of oligos are usually measured in µM or nM (1 µM = 1 µmol/L = 1 pmol/µl).
- For large PCR fragments > 500 bp, plasmid DNA, or transcripts, an approximate extinction coefficient is usually used based on the length in base pairs (assuming of 25% each base) and concentration is measured in ng / µl:
- Double-stranded DNA: 50 cm-1 (ng / µl)-1
- Single-stranded DNA: 33 cm-1 (ng / µl)-1
- Single-stranded RNA: 40 cm-1 (ng / µl)-1
- For oligos containing fluorescent probes or quenchers, you can alternatively use the absorption of these at their peak wavelengths. This can be particularly useful if they are well separated from the nucleic acid base peak.
- Using the Nanodrop or a UV/Vis spectrophotometer. Record a wavelength scan from about 200 nm to 600 nm. Do not just look at the A260 number unless you have a lot of experience with a protocol. Looking at the wavelength scan can help you diagnose common problems, such as too much salt in your sample or protein contamination.
NanoDrop Protocol
- Take samples, pipette tips, and tube of blank solution (typically water or elution buffer depending on what your DNA was eluted in) to the NanoDrop.
- Log into computer and rinse pedestal and arm with dH2O. Dry with a Kimwipe.
- Initialize the NanoDrop 1000 software by double clicking on the NanoDrop icon.
- Select 'Nucleic Acid'
- Pipette 1 µl liquid from blank tube onto pedestal and lower the arm.
- Hit 'ok' on computer to blank the instrument
- Use a Kimwipe to dry the pedestal. Reload a fresh 1µl aliquot from blank tube onto pedestal, and lower arm back down.
- Select Re-Blank from the top left of the window.
- Use Kimwipe to dry pedestal. Load 1 µl of sample onto pedestal and lower the arm.
- Enter sample name on the right hand side of the window, and select 'Measure' on the top left.
- Inspect the curve to ensure it consists of a high reading on the left, a dip, another peak, and then a slope to the baseline.
- Record concentration of sample in your lab notebook.
If measuring multiple samples, you can wait until the end and use the 'report - show report - save report - save as csv table' option to have a record of all estimated DNA concentrations and the 260/280 260/230 ratios.
- Repeat drying and loading of samples till done.
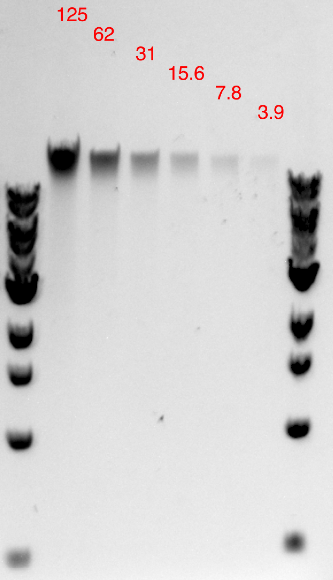
Agarose Gel Electrophoresis
Agarose Gel Electrophoresis Protocol
- Pour agarose gel.
- Percentage of the gel should be based on range of linear separation.
- Be sure to use a ladder with known amounts of each size marker (for instance the 1 kb NEB marker).
- Load different amounts of DNA such that you estimate that at least 1 well has between 30 ng and 125 ng of DNA.
- Run the gel until you achieve good separation of marker.
- Take image of gel on imager.
Remember that low percentage gels will diffuse quickly necessitating a quick return to electrophoresis if needed.
- Estimate the amount of DNA in each well (ng) as compared to known quantities of different bands.
The imager software has a way of creating a standard curve and estimating concentrations from it. - Determine the concentration of DNA (ng/µl) from your measured quantity (ng) based on number of µl loaded in each well.
Further Information
Barrick Lab > ProtocolList > DNAConcentrationDetermination