Difference: PrimerEfficiencyqPCR (1 vs. 6)
Revision 62023-02-01 - DanielDeatherage
Primer Efficiency qPCRGoals
| ||||||||
| Changed: | ||||||||
| < < |
| |||||||
| > > |
| |||||||
 (Numbers are PCR product dilution with "10" representing a 1:10 dilution of your 0.01ng/ul PCR product prepped as described above)
Template Material
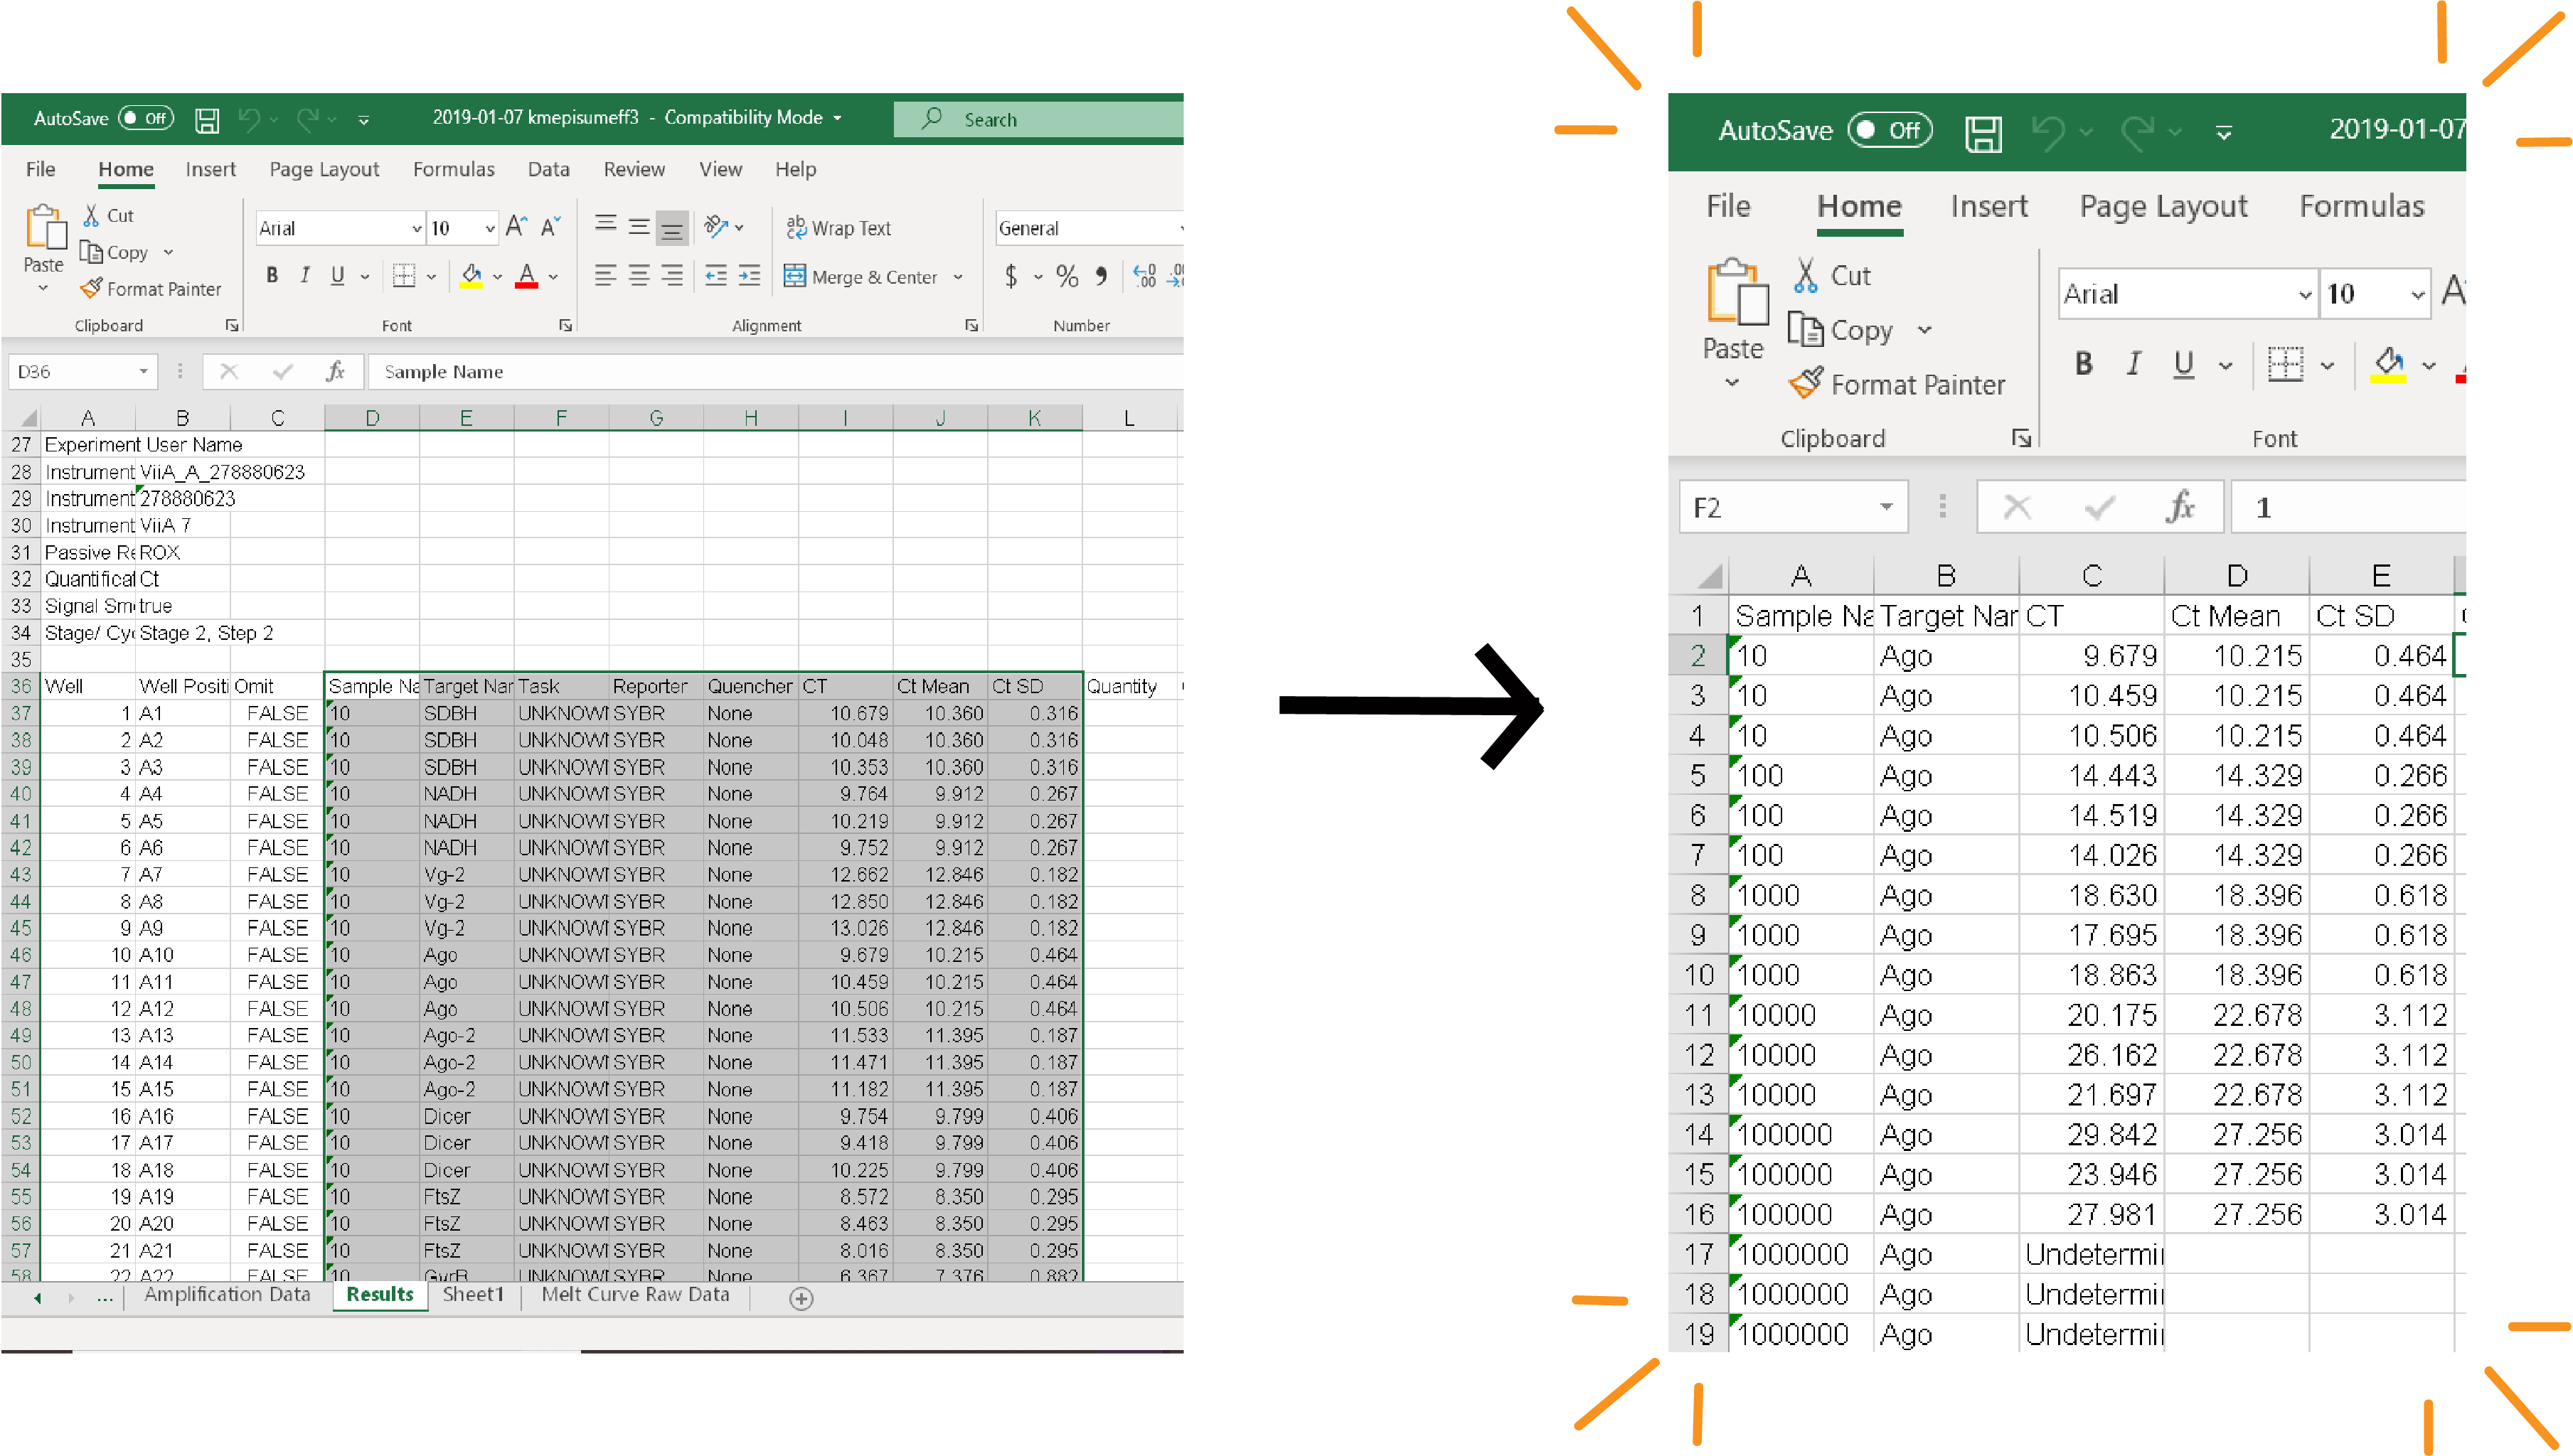
AnalysisAs long as you have met the criteria that I laid out above you're good to move on to calculating your primer efficiencies. Step 1: Rearrange your data.Your data is likely in an ugly format. I would recommend rearranging it (keep all that raw data though!!!!!) as shown below:  (Copy over the Sample and Target Name, CT, CT Mean, and CT SD columns and rearrange so that they're grouped by target)
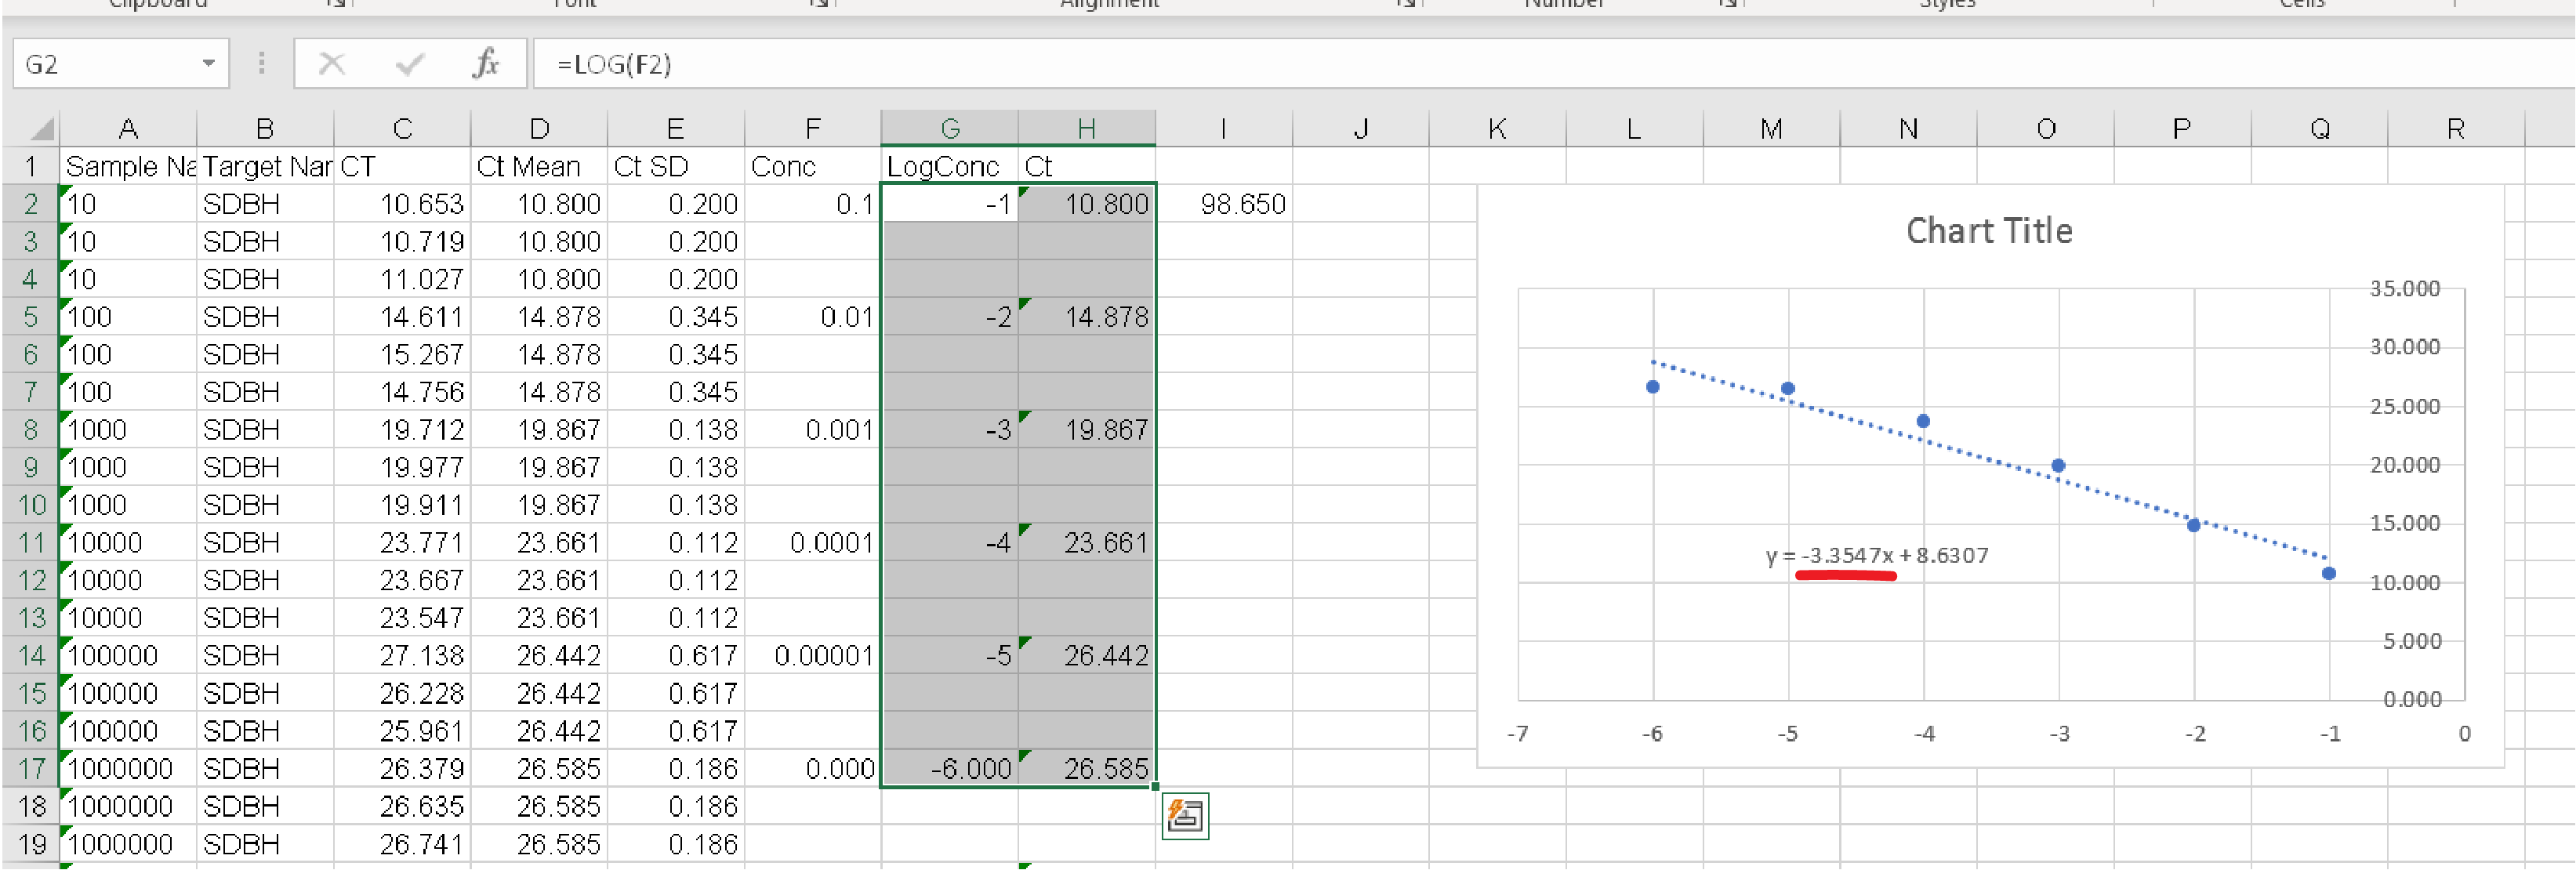
Step 2: Calculate the linear regression equation for each target.
 1. Calculate the Log Concentration of your samples (if your sample is 1:10 then the Concentration is 0.1 and the Log Concentration is -1) 2. Using Excel create a plot where the Log Concentration is on the x-axis and the Mean Ct for your 3 technical replicates is on the y-axis. Display the linear regression formula on the chart.  Step 3: Calculate your Primer Efficiencies.
 Plug your slopes into this CALCULATOR and CONGRATULATIONS you've got primer efficiencies! You want to achieve primer efficiencies between 90 and 110%. If your primers are not within that range it is most likely an error with this qPCR reaction. When the standard deviations between samples are wide it really throws off this calculation. Did you perhaps let something slide from the "What you are looking for" category that you shouldn't have? You may have to repeat this reaction again. If your results have been extremely clean however, you should redesign your primers. <<Return to qPCR page -- Main.KateElston - 21 Mar 2019
| ||||||||
Revision 52020-04-09 - KateElston
Primer Efficiency qPCR | ||||||||
| Deleted: | ||||||||
| < < | THIS PAGE IS CURRENTLY UNDER CONSTRUCTION | |||||||
Goals
 (Numbers are PCR product dilution with "10" representing a 1:10 dilution of your 0.01ng/ul PCR product prepped as described above)
Template Material
| ||||||||
| Added: | ||||||||
| > > | Analysis | |||||||
| Added: | ||||||||
| > > | As long as you have met the criteria that I laid out above you're good to move on to calculating your primer efficiencies. | |||||||
| Added: | ||||||||
| > > | Step 1: Rearrange your data. Your data is likely in an ugly format. I would recommend rearranging it (keep all that raw data though!!!!!) as shown below: | |||||||
| Added: | ||||||||
| > > |  (Copy over the Sample and Target Name, CT, CT Mean, and CT SD columns and rearrange so that they're grouped by target)
Step 2: Calculate the linear regression equation for each target.
 1. Calculate the Log Concentration of your samples (if your sample is 1:10 then the Concentration is 0.1 and the Log Concentration is -1) 2. Using Excel create a plot where the Log Concentration is on the x-axis and the Mean Ct for your 3 technical replicates is on the y-axis. Display the linear regression formula on the chart.  Step 3: Calculate your Primer Efficiencies.
 Plug your slopes into this CALCULATOR and CONGRATULATIONS you've got primer efficiencies! You want to achieve primer efficiencies between 90 and 110%. If your primers are not within that range it is most likely an error with this qPCR reaction. When the standard deviations between samples are wide it really throws off this calculation. Did you perhaps let something slide from the "What you are looking for" category that you shouldn't have? You may have to repeat this reaction again. If your results have been extremely clean however, you should redesign your primers. | |||||||
| <<Return to qPCR page -- Main.KateElston - 21 Mar 2019 | ||||||||
| Deleted: | ||||||||
| < < | ||||||||
| ||||||||
| Added: | ||||||||
| > > |
| |||||||
Revision 42020-02-20 - KateElston
Primer Efficiency qPCRTHIS PAGE IS CURRENTLY UNDER CONSTRUCTION Goals
 (Numbers are PCR product dilution with "10" representing a 1:10 dilution of your 0.01ng/ul PCR product prepped as described above)
 | ||||||||
| Changed: | ||||||||
| < < | Conditions | |||||||
| > > | Template Material | |||||||
| ||||||||
Revision 32019-04-05 - KateElston
| ||||||||
| Added: | ||||||||
| > > | Primer Efficiency qPCR | |||||||
THIS PAGE IS CURRENTLY UNDER CONSTRUCTION
Goals
 (Numbers are PCR product dilution with "10" representing a 1:10 dilution of your 0.01ng/ul PCR product prepped as described above)
Conditions
 | ||||||||
| Added: | ||||||||
| > > |
| |||||||
| What you are looking for | ||||||||
| Added: | ||||||||
| > > |
| |||||||
<<Return to qPCR page
-- Main.KateElston - 21 Mar 2019
| ||||||||
Revision 22019-04-03 - KateElston
| ||||||||
| Added: | ||||||||
| > > | Goals
 (Numbers are PCR product dilution with "10" representing a 1:10 dilution of your 0.01ng/ul PCR product prepped as described above)
Conditions
What you are looking for
<<Return to qPCR page
 | |||||||
| -- Main.KateElston - 21 Mar 2019 | ||||||||
| Added: | ||||||||
| > > |
| |||||||
Revision 12019-03-21 - KateElston
|
View topic | History: r6 < r5 < r4 < r3 | More topic actions...